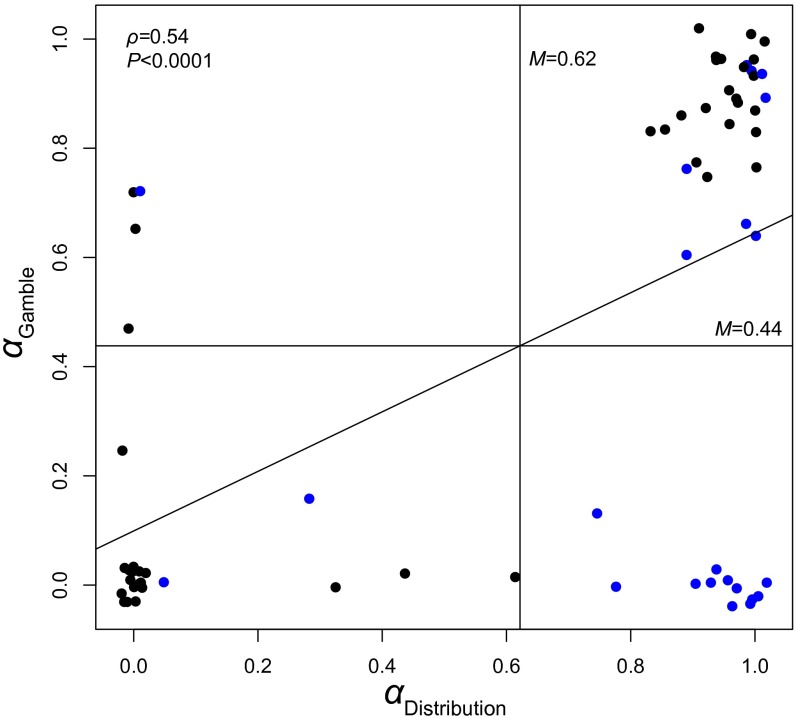
Fig. S1.
Scatterplots of individual maximin weights for distributions (αdistribution) and gambles (αgamble) derived from participants’ 40 choices using Charness–Rabin’s quasi-maximin model (6) (Eq. S1). αi ∊ [0, 1] is a parameter that captures the weight reflecting the maximin principle. Individuals with α = 1 in distributions correspond to pure Rawlsians, for whom welfare is measured solely by the maximin criterion. Individuals with α = 0 in distributions correspond to pure utilitarians (for details of the quasi-maximin model, see SI Materials and Methods, Economic model for maximin weight estimation). Participants who preferred the maximin distributions for others (higher αdistribution) tended to favor the maximin gambles for themselves (higher αgamble) (ρ = 0.54; P < 0.0001). The mean α was also significantly greater in distributions (M = 0.62) than in gambles (M = 0.44) [F(1,65) = 14.39; P < 0.001], corroborating the more frequent maximin choices in distributions than in gambles. Points colored in blue correspond to the participants classified as Rawlsians in distributions for others but largest-total seekers in gambles for self according to their most frequent choices (Fig. 1B).

