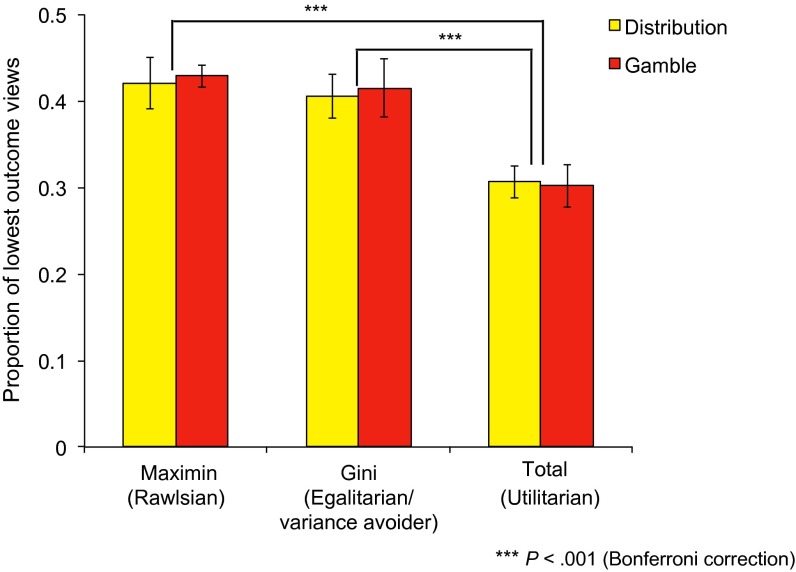
Fig. S3.
Average proportion of lowest outcome (L) views preceding choices by participant type. Utilitarians viewed the lowest outcomes less frequently than Rawlsian and Gini types [F(2,132) = 9.82; P < 0.001]. Error bars represent SEM. For details, see SI Materials and Methods, Analysis of frequencies of lowest outcome (“L”) view by participant type.

