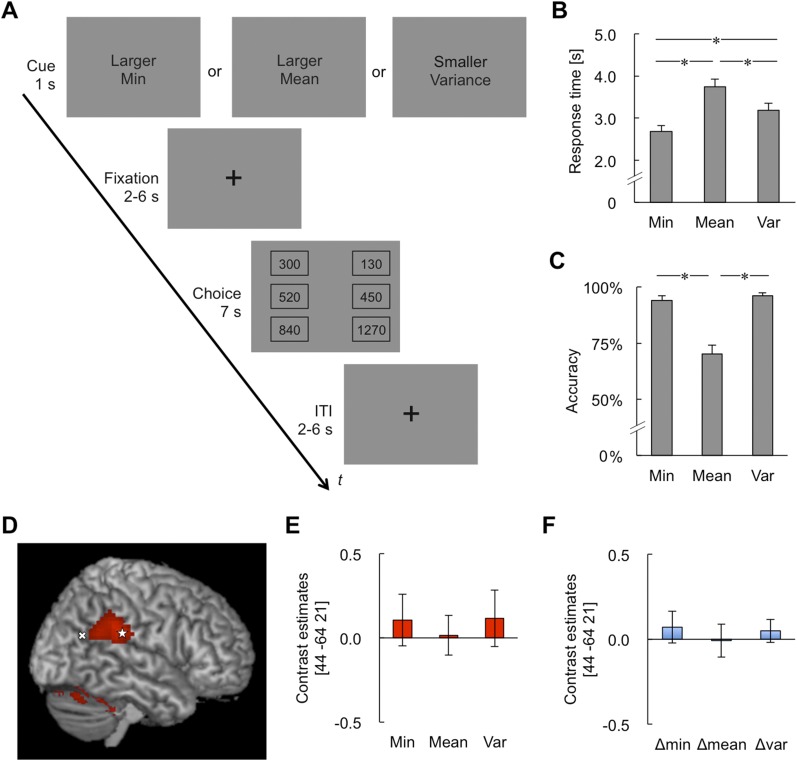
Fig. S6.
Results from the follow-up fMRI experiment. (A) Task flow of each trial. (B) Response time in the three conditions: larger minimum (Min), larger mean (Mean), and smaller variance (Var). Asterisks show significant difference (*P < 0.05). (C) Response accuracy. (D) The activation in the RTPJ observed in the contrast “Min vs. others” (red colored). Labeling of this activation indicated the supramarginal gyrus. The star symbol shows the overlaid peak of this activation. The “X” shows the overlaid peak (based on the conjunction analysis) from the main experiment. (E) The RTPJ activity in each condition. (F) Parametric modulation for ΔMin, ΔMean, and ΔVariance in the RTPJ in Min trials.

