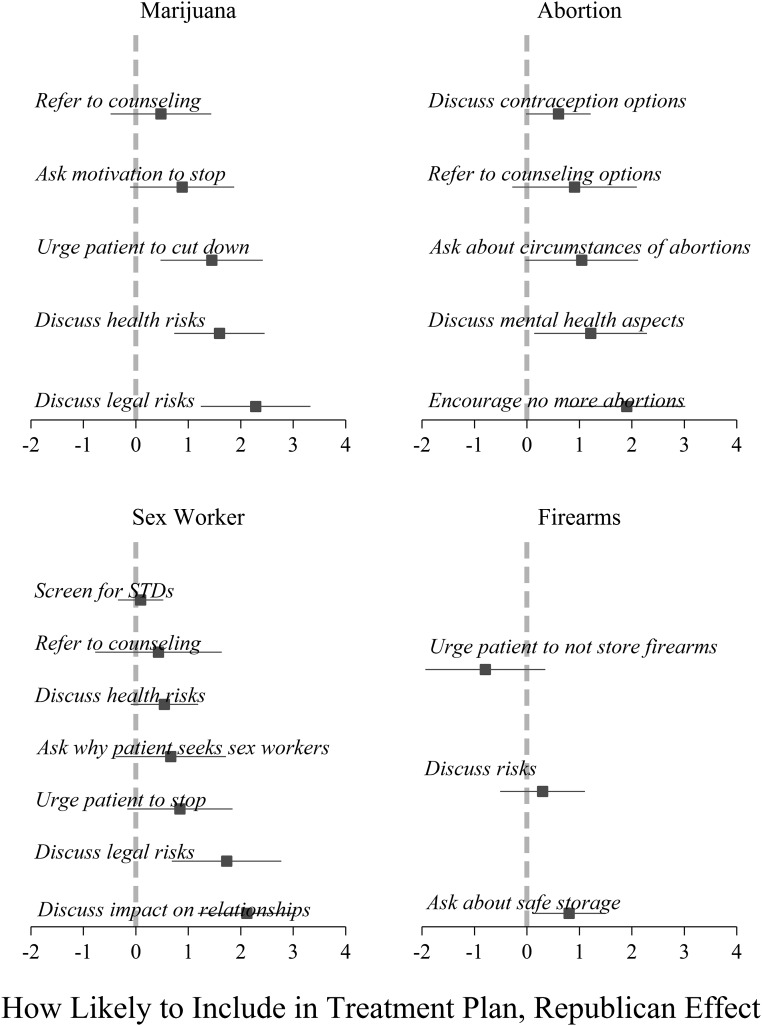
Fig. 3.
Partisan differences in treatment plans on politicized issues. Points represent coefficients from regression, with 95% CIs. Positive values indicate that Republicans are more likely to include a particular item in a treatment plan; negative values indicate that Democrats are more likely to do so.

