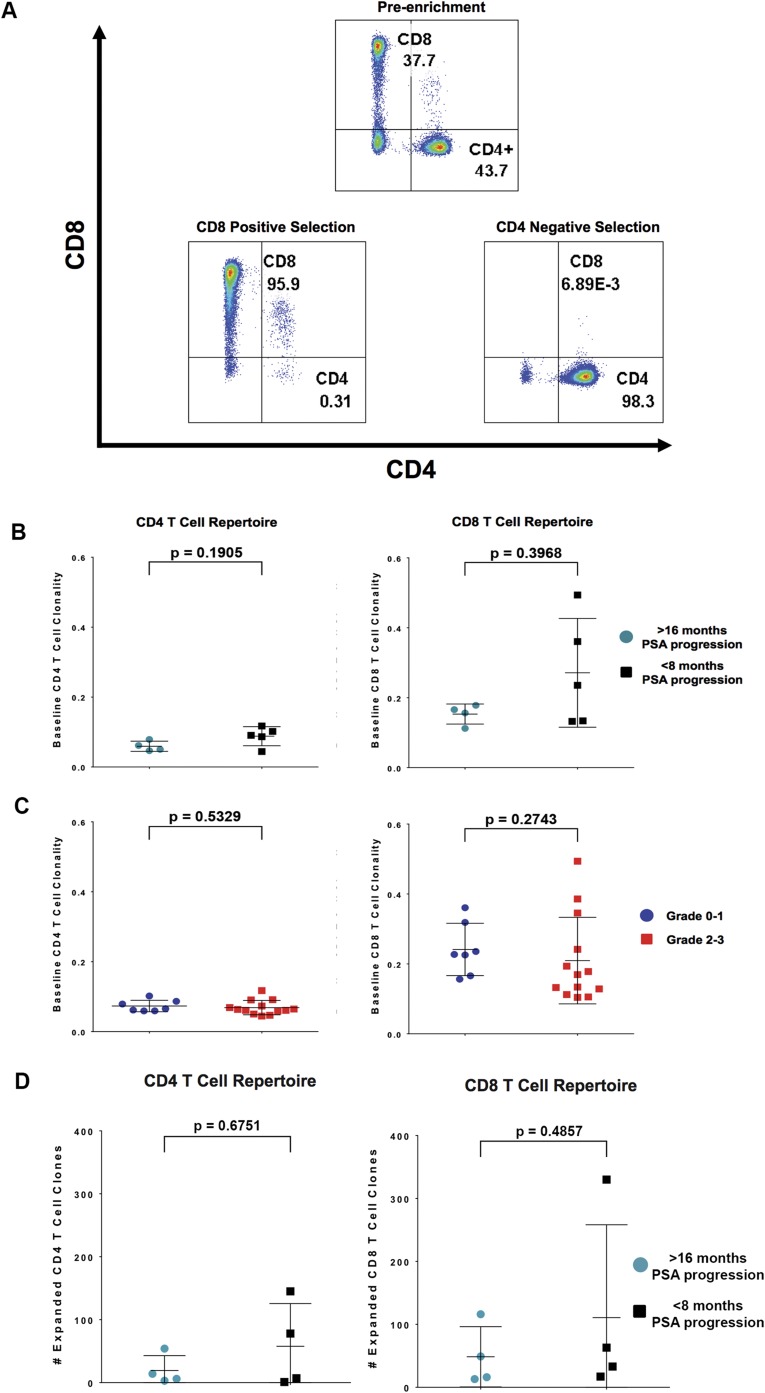
Fig. S2.
Enrichment of CD4 and CD8 T cells from PBMCs and immunological biomarkers. (A) (Top) CD4 and CD8 T-cell expression in PBMCs based on flow cytometric analysis. Following purification of CD4 T cells (negative selection) and CD8 T cells (positive selection) from PBMCs, flow cytometric analysis was used to determine the purity of the CD4 (Bottom Right) and CD8 (Bottom Left) T-cell populations. In this patient, the CD4 population is enriched from 43.7% to 98.3% purity, and the CD8 population is enriched from 37.7% to 95.9%. (B) Baseline CD4 and CD8 T-cell clonality from pre-IPI (baseline) treatment samples were used to determine T-cell clonality and to make comparisons between patients who experienced PSA progression greater than 16 mo (clinical benefit) vs. less than 8 mo (no clinical benefit). (C) Baseline CD4 and CD8 T-cell clonality from pre-IPI (baseline) treatment samples was used to determine T-cell clonality and to make comparisons between patients who experienced grade 0–1 irAEs vs. grade 2–3 irAEs. (D) Comparison between patients who experienced PSA progression greater than 16 mo (clinical benefit) vs. less than 8 mo (no clinical benefit). The number of expanded T-cell clones was determined from post-IPI dose 1 vs. baseline samples.

