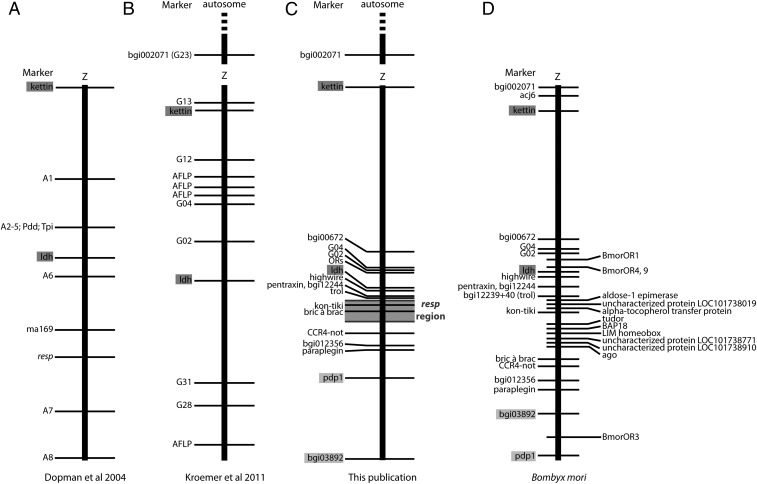
Fig. 2.
Comparison of linkage maps of O. nubilalis and linkage and physical maps for B. mori. Genes common to all maps are shown in dark gray, and gene inversions are shown in light gray. (A–C) Compare our results with previously published results on O. nubilalis. (A) Adapted from Dopman et al. (13). (B) Adapted from Kroemer et al. (37). (C) Our results. (D) B. mori sex chromosome gene linkage. Z is the sex chromosome. Thick lines represent the chromosomes, and the dashed line shows the direction in which the chromosome continues.

