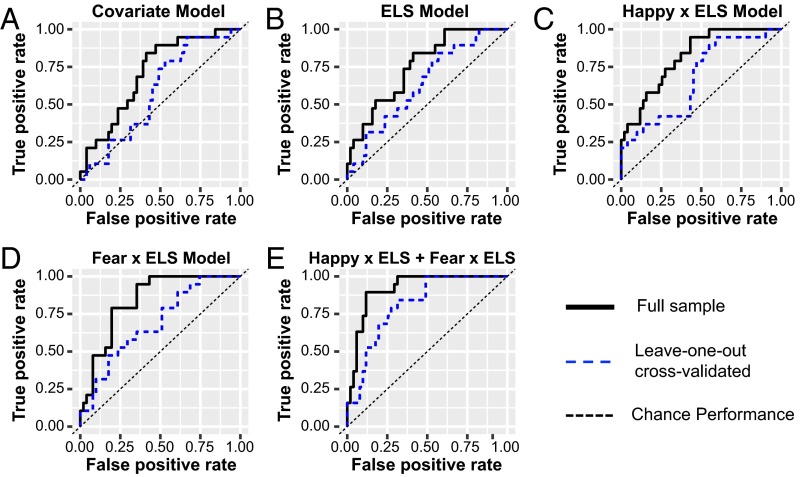
Fig. 1.
ROC curves showing the relative performance of candidate regression models in predicting functional remission. ROC curves model performance in predicting functional remission for 70 participants using the following predictors: (A) demographic/clinical measures; (B) demographic/covariate measures and ELS; (C) demographic/covariate measures and the interaction between amygdala reactivity to happy faces and ELS; (D) demographic/covariate measures and the interaction between amygdala reactivity to fearful faces and ELS; and (E) demographic/clinical covariates, the interaction between ELS and amygdala reactivity to happy faces, as well as the interaction between ELS and amygdala reactivity to threatening faces.

