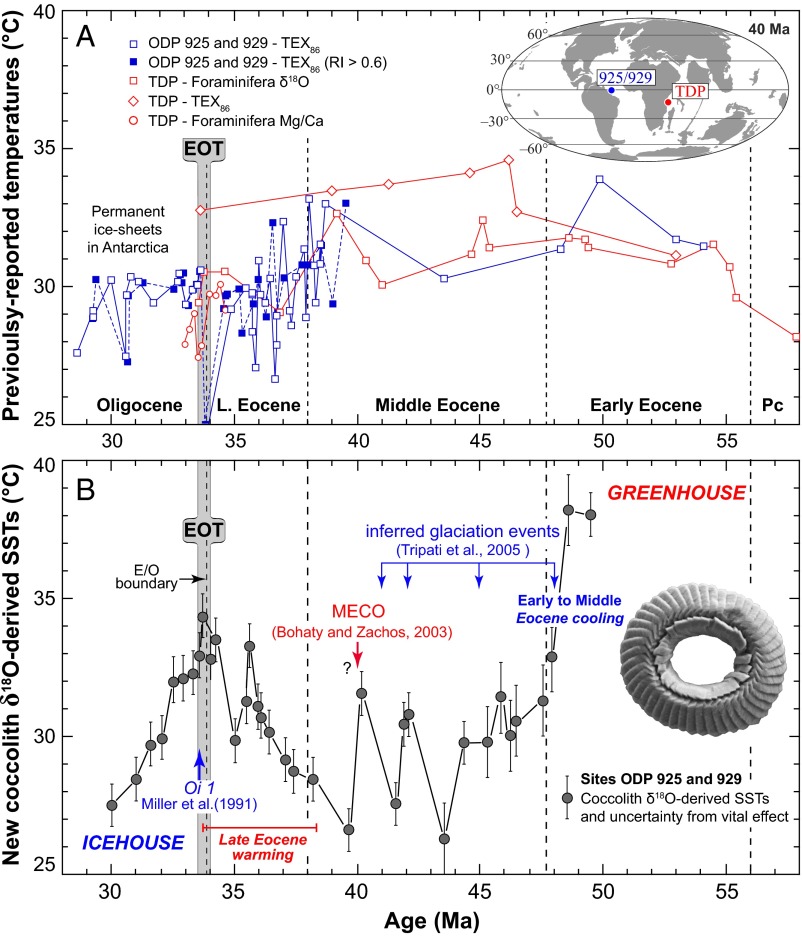
Fig. 1.
Reconstructed equatorial SSTs during the Early Eocene to the Early Oligocene. (A) Multiproxy temperature estimates from the TDP (in red) indicate a warm and relatively stable Eocene climate (2). The blue curve denotes published TEX86-derived SSTs (3, 4) in the equatorial Atlantic showing relatively similar temperatures in the Eocene and the Early Oligocene. Note that alkenone temperatures (UK’37) from ref. 3 are not presented, as they exceeded the upper limit of the proxy (i.e., >29 °C). For data source ODP 925 and 929, open symbols denote refs. 3 and 4, and filled symbols denote samples with a Ring Index > 0.6 from ref. 5; TDP data are from refs. 2 and 35. (Inset) The location map is modified from ref. 29. (B) Coccolith δ18O-derived temperatures from sites ODP 925 and 929 applying Eq. 1. The raw isotope data are shown in Fig. S4A. A correction of the vital effect of 0.69‰ (SD = 0.11‰) was applied to coccoliths gathered into 3–5-µm fractions (see corresponding biogeochemical discussion in SI Materials and Methods). Disregarding the problem of the vital effect would translate the temperature curve by a constant −3.7 °C offset (see Fig. S4D for SSTs derived from the 5–8-µm fractions). Early to Middle Eocene cooling highlights the termination of the greenhouse period. After climate ups and downs in the Middle Eocene (30–32), including the Middle Eocene Climatic Optimum (MECO), a Late Eocene 6 °C warming predates the pronounced cooling seen coeval with the onset of glaciation during the Early Oligocene. (Inset) The SEM image shows a reticulofenestrid specimen from a sample at 42.1 Ma (see Fig. S5A for an edited version and the scale bar).

