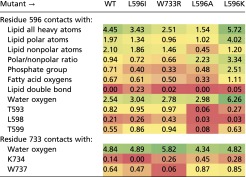
Table S1.
Contacts of side chains of the residues 596 and 733 with lipids, water, and key protein residues observed in MD simulations of the WT channel and four mutants
 |
The contacts are quantified as the total for all nonhydrogen atoms. The data were collected over the last 0.2 ns of the second refinement cycle and averaged over two independent simulation sets. The table is color coded from the lowest (red), through medium (yellow), to the highest (green) frequency of contacts.
