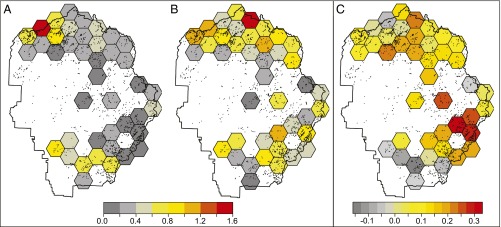
Fig. 3.
Spatial variation in population abundance and growth rate from 1993 to 2012 in counts of adult R. sierrae across Yosemite National Park. Grid cells in A and B depict the estimated counts of R. sierrae averaged across all water bodies in the cell for the first 3 y of the study (1993–1995) and the last 3 y of the study (2010–2012), respectively. Average counts are low (zero to two frogs per water body), because only a minority of water bodies in the cell provide high-quality habitat. C depicts the trend in population abundance between those two time points. Values in C are the intrinsic rates of growth (r), where values greater than zero indicate positive growth and values less than zero indicate negative growth. Frog abundance was notably higher at the end of the study compared with the beginning as reflected in the positive growth rates for most cells.

