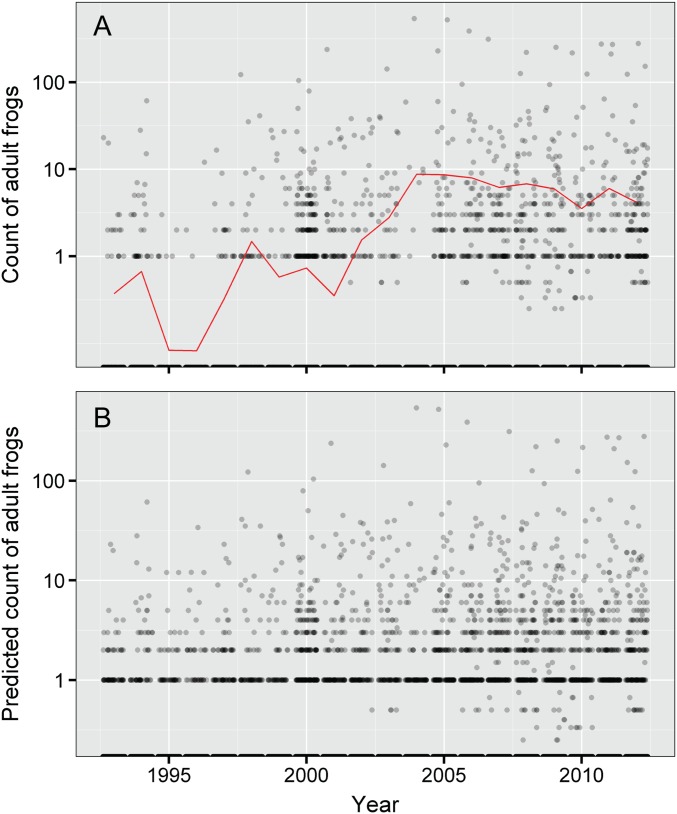
Fig. S1.
Trends in frog abundance during the 20-y study showing results used to generate Fig. 1: (A) actual counts of adult R. sierrae for all sites sampled in each year (points) and average annual counts (red line) and (B) actual counts for sampled water bodies and predicted counts for unsampled water bodies based on the estimated distribution in the trend model. In A and B, when more than one survey was conducted per year, results were averaged by year. Y axes are shown on a log scale. Although only a subset of sites was surveyed in any 1 y (shown in A), the general distribution of points in A is similar to that in B, which is based on actual and predicted counts at all water bodies. Average values from B were used to create the trend line and 95% CI in Fig. 1.

