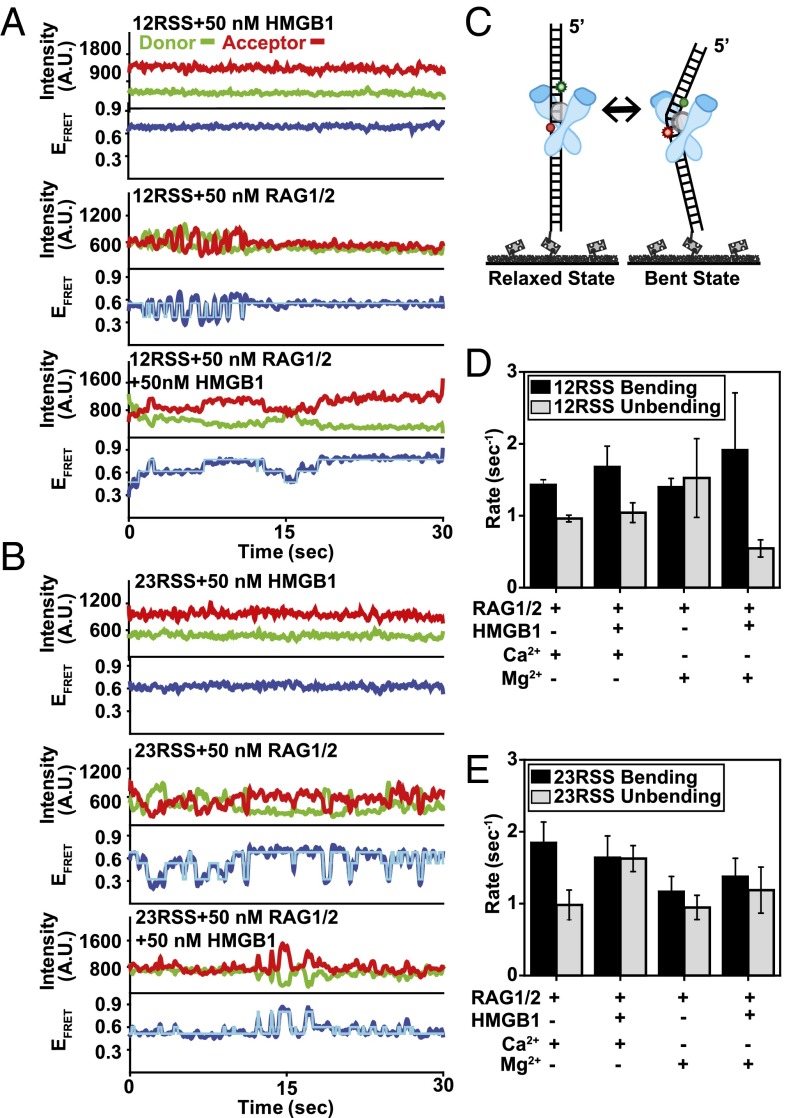
Fig. 2.
Conformational dynamics of the SC and evaluation of HMGB1 stabilization. (A and B) Representative smFRET trajectories for 12RSS (A) and 23RSS (B) substrates in the presence of 50 nM RAG1/2, 50 nM HMGB1, and 50 nM RAG–HMGB1 complex (Mg2+) shown in the Top, Middle, and Bottom trajectories, respectively. For each smFRET trajectory, the top panel displays donor (green) and acceptor (red) intensities and the bottom panel displays the corresponding FRET efficiency (EFRET) in blue. HMM fit is in cyan. (C) Illustration of RSS substrate transitioning between the low-FRET (relaxed) state and the high-FRET (bent) state. (D and E) Calculated mean binding and dissociation rates for 12RSS (D) and 23RSS (E) substrates with different proteins and ions in solution (error bars, s.e.m.; n > 20 for all measurements).

