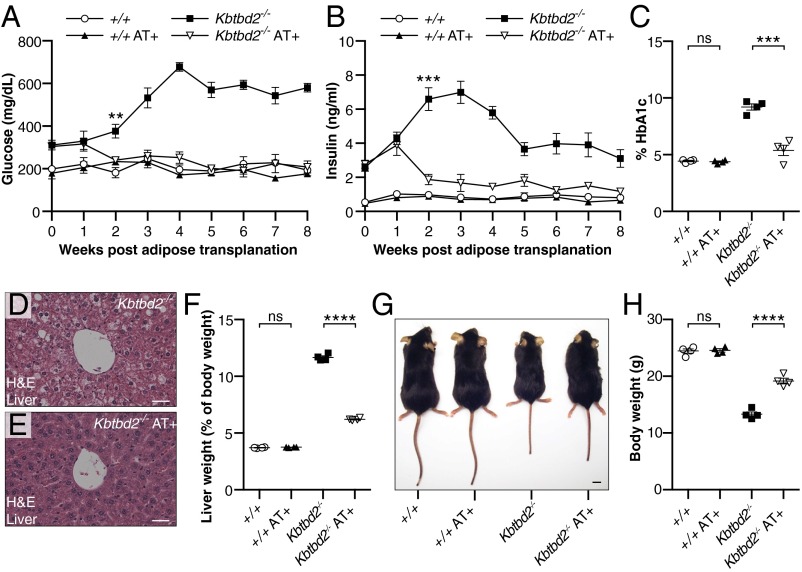
Fig. 3.
WT adipose tissue transplantation rescues the tny phenotype. Surgery was performed at 4 wk of age, and mice received WT adipose tissue (AT+) or PBS (n = 4 mice of the indicated genotype per condition). (A and B) Blood glucose (A) and serum insulin (B) in mice before (0 wk) and at the indicated times after adipose transplantation. (C) HbA1c in blood of mice 8 wk after transplantation. (D and E) H&E staining of sections from liver of Kbtbd2−/− or Kbtbd2−/− AT+ mice at 12 wk after transplantation. (Scale bars: 30 μm.) (F–H) Liver weight normalized to body weight (F), representative photograph (G), or body weight (I) of mice at 12 wk after transplantation. (Scale bar in G: 1 cm.) Data points represent individual mice (C, F, and H). P values were determined by Student’s t test.

