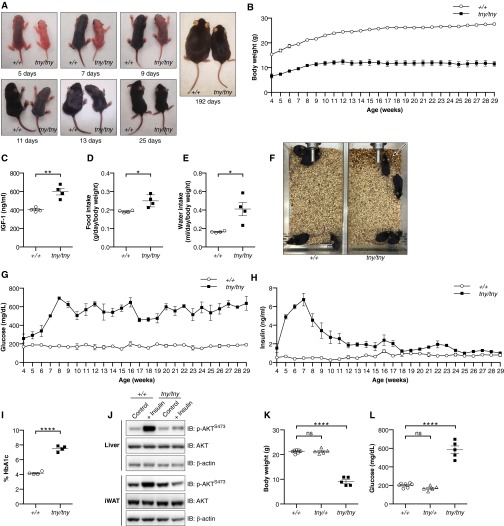
Fig. S1.
The teeny phenotype. (A) Photographs of homozygous tny mice and WT littermates at different ages after birth. (B) Growth curve of male homozygous tny mice (n = 3) and WT littermates (n = 3) from 4 wk of age to 29 wk of age. (C) Serum IGF1 in 8-wk-old male mice. (D and E) Food (D) and water (E) intake of 8-wk-old male mice. (F) Photographs of cages with 8-wk-old male homozygous tny mice (n = 4) or WT littermates (n = 4) at 2 d after cage change. The tny/tny cage was wetted with urine (arrow). (G and H) Blood glucose (G) and serum insulin (H) were measured in male homozygous tny mice (n = 3) and WT littermates (n = 3) at weekly intervals, each time after a 6-h fast, beginning at 4 wk of age. (I) HbA1c in the blood of 8-wk-old male mice. (J) Immunoblots of liver and adipose tissue lysates from 4-wk-old male homozygous tny/tny mice and WT littermates, with or without insulin injection. Insulin or saline was injected i.p. at a dose of 1.5 U/kg body weight. Tissues were removed for analysis at 30 min postinjection. (K and L) Body weight (K) and blood glucose levels (L) of male homozygous tny, heterozygous tny, and WT mice at 8 wk of age. Glucose was measured after a 6-h fast. In C–E, H, K, and L, data points represent individual mice. P values were determined by Student’s t test.

