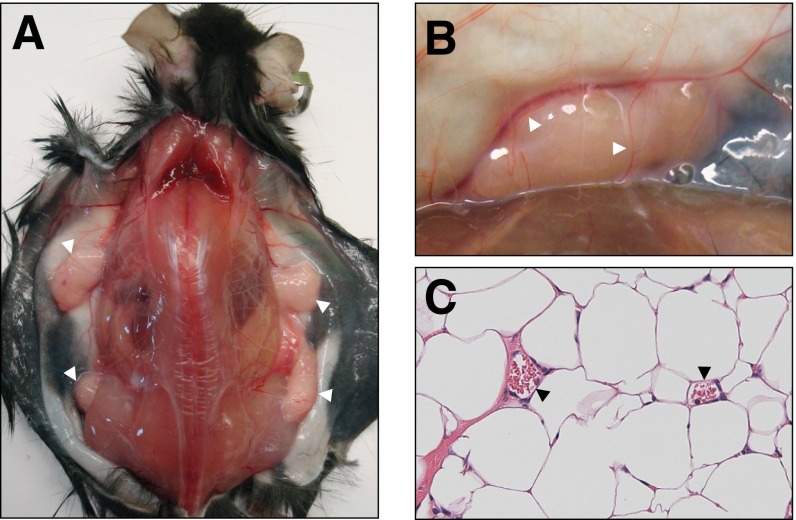
Fig. S2.
Adipose transplantation of tny mice. (A) Representative photograph of a Kbtbd2−/− mouse at 12 wk after transplantation of adipose tissue from a WT mouse (Kbtbd2−/− AT+). Skin was dissected to show the adipose tissue grafts (white arrowheads). (B) Enlarged view of an adipose tissue graft showing the blood vessels (arrowheads) supplying the graft. (C) H&E staining of a section of grafted adipose tissue. Red blood cells are visible (arrowheads) in the blood vessels.

