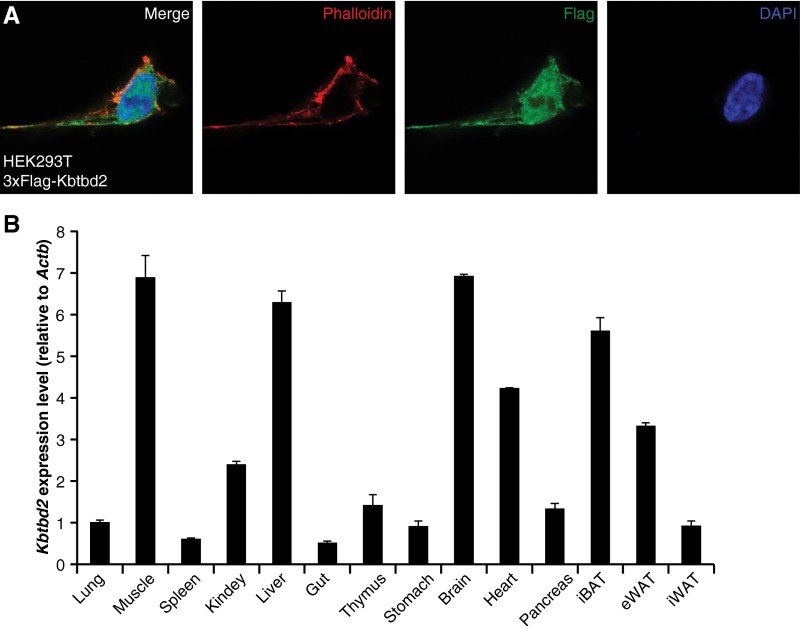
Fig. S3.
Subcellular location of the KBTBD2 protein and expression profile of Kbtbd2 transcript. (A) 293T cells expressing 3×FLAG-tagged KBTBD2 protein were immunostained with FLAG (green) antibody, phalloidin (red) to visualize F-actin, and DAPI (blue) to visualize nuclei. (B) Kbtbd2 transcript levels normalized to Actb mRNA in different tissues of male C57BL/6J mice at 8 wk of age (n = 3).

