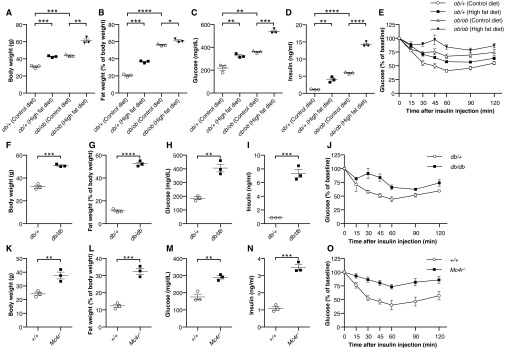
Fig. S6.
Phenotypes of Lepob/ob, Leprdb/db, and Mc4r−/− mice. (A–E) Male Lepob/+ (ob/+) or Lepob/ob (ob/ob) littermates were maintained on the control diet (n = 3) or high-fat diet (n = 3) for 8 wk, beginning at 6 wk of age. Experiments were conducted at 14 wk of age. (F–J) Male Leprdb/+ (db/+; n = 3) and Leprdb/db (db/db; n = 3) littermates were maintained on standard chow from birth. Experiments were conducted at 16 wk of age. (K–O) Male Mc4r−/− mice (n = 3) and WT mice (+/+; n = 3) were maintained on standard chow from birth. Experiments were conducted at 9 wk of age. (A, F, and K) Body weight. (B, G, and L) Normalized fat weight. (C, H, and M) Blood glucose levels. (D, I, and N) Serum insulin levels. Glucose and insulin were measured after a 6-h fast. (E, J, and O) Insulin tolerance test. Blood glucose was measured at indicated times after i.p. insulin injection. Baseline blood glucose levels (0 min): control diet [ob/+, 218 ± 20 mg/dL; ob/ob, 361 ± 6 mg/dL]; high-fat diet [ob/+, 325 ± 10 mg/dL; ob/ob, 539 ± 12 mg/dL; db/+, 186 ± 11 mg/dL; db/db, 406 ± 28 mg/dL; Mc4r+/+, 176 ± 17 mg/dL; Mc4r−/−, 290 ± 10 mg/dL]. In A–D, F–I, and K–N, data points represent individual mice. P values were determined by Student’s t test.

