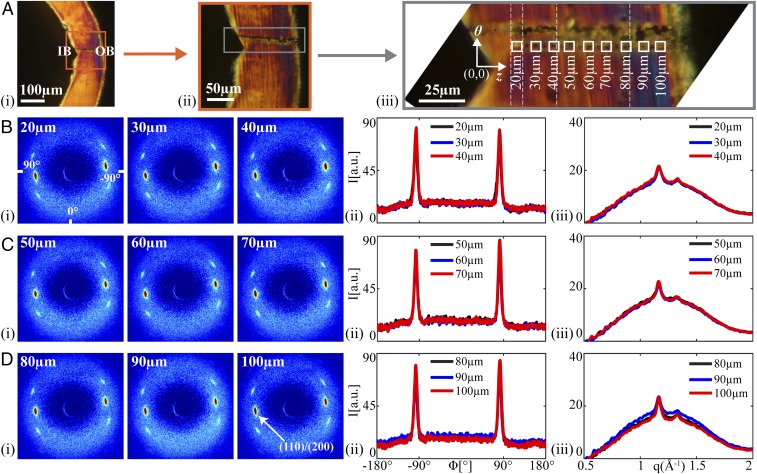
Fig. 5.
Structural characterization of a deployed U section (D40; bold rectangle in Fig. 4B). (A) Polarized light micrographs of D40 with increasing magnification from A, i, to provide context relative to the IB and OB, to (A, iii) a composite image (vertical dotted lines mark transitions between images) that shows positions of microdiffraction acquisitions (marked using the X-ray beam). Squares correspond to patterns shown in B–D. Microdiffraction data acquired (B) close to the IB, (C) midway between the IB and OB, and (D) close to the OB: (i) X-ray microdiffraction patterns, (ii) azimuthal intensity distribution I(ϕ) at the (110)/(200) diffraction (identified in D, i, azimuthal coordinates in B, i, averaged over q ∈ 1.08–1.24 Å−1), and (iii) radial intensity distribution I(q) (azimuthally averaged).

