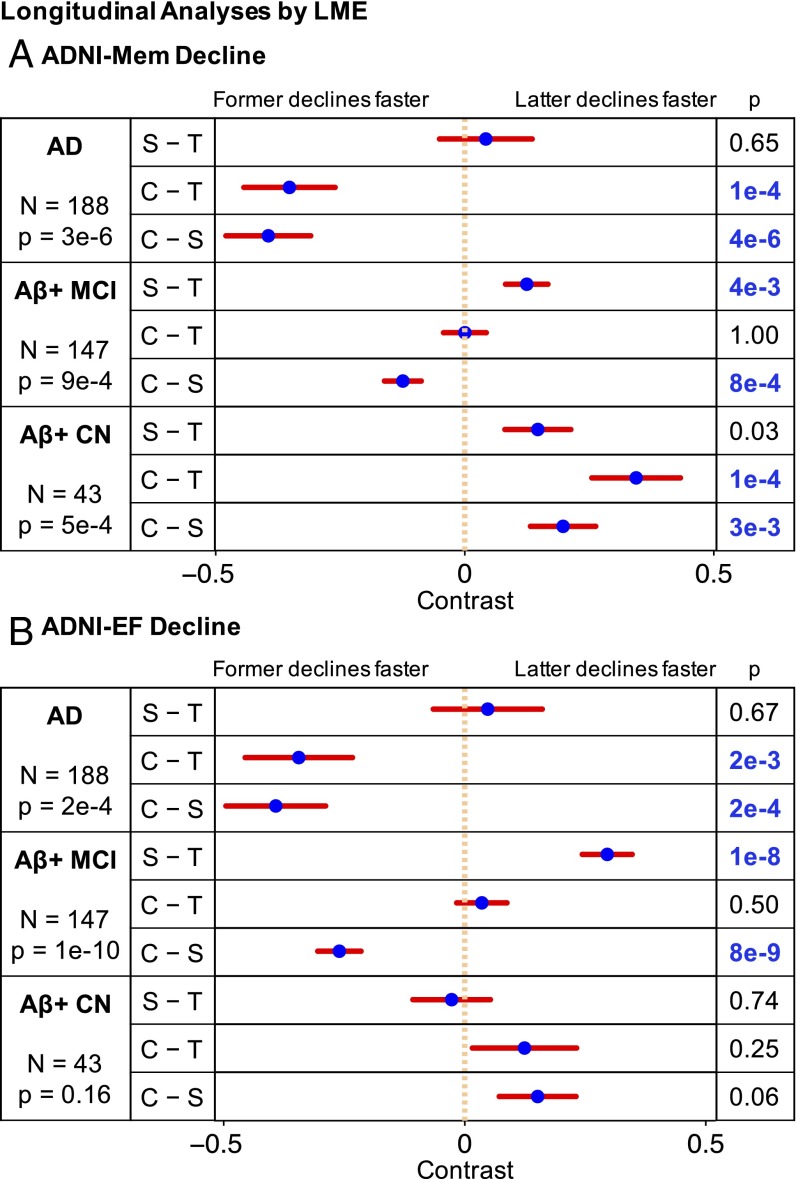
Fig. 7.
Comparisons of (A) memory and (B) executive function decline rates across factors by clinical group. Comparisons remaining significant after FDR (q = 0.05) control are highlighted in blue. T, S, and C indicate temporal, subcortical, and cortical factors, respectively. Blue dots are estimated differences between pure atrophy factors, and red bars show the SEs (SI Appendix, SI Methods). For example, the second row in A suggests that AD dementia patients expressing the cortical factor showed faster memory decline than patients expressing the temporal factor (P = 1e−4).

