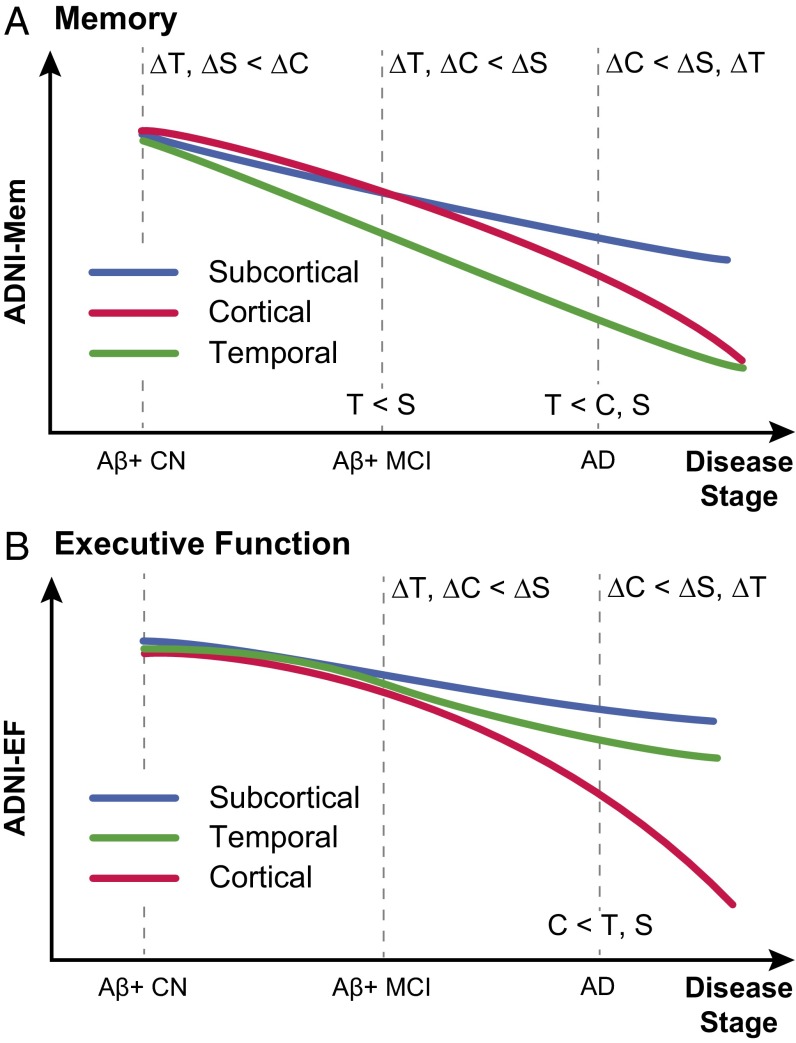
Fig. 8.
Schematics of distinct (A) memory and (B) executive function trajectories for temporal, subcortical, and cortical atrophy factors. T, S, and C indicate temporal, subcortical, and cortical factors, respectively. Labels on dotted lines indicate cross-sectional differences. For example, T < C, S in A indicates that the temporal factor was associated with the worst baseline memory among AD dementia patients. Labels in the intervals indicate differences in longitudinal decline rates. For example, ΔT, ΔC < ΔS in B indicates that, among Aβ+ MCI participants, the temporal and cortical factors were associated with faster executive function decline than the subcortical factor. The schematics summarize the behavioral results of Figs. 5, 6, and 7 (more discussion is in SI Appendix, SI Results). Within each cognitive domain, the atrophy factors were associated with distinct trajectories across the stages. The trajectories of the cortical and subcortical factors transpose between the two cognitive domains. Divergence in memory trajectories existed even at the asymptomatic stage of the disease (i.e., among Aβ+ CN participants).

