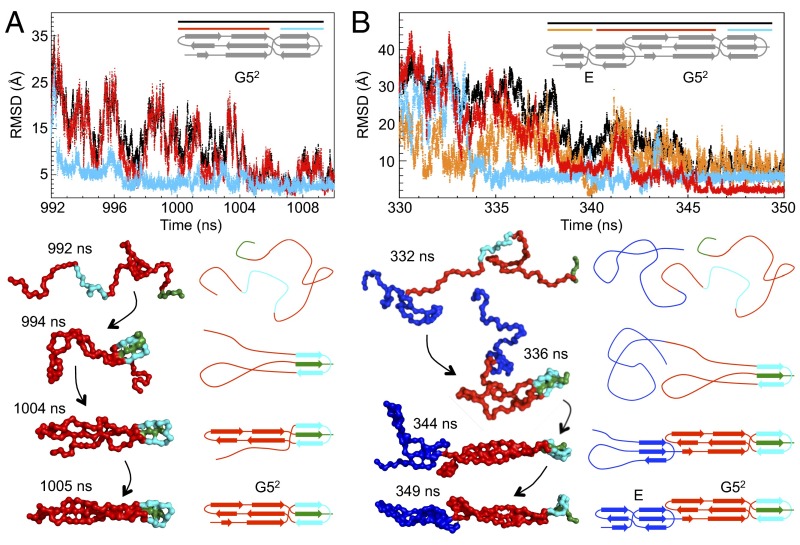
Fig. 3.
Probing the folding pathways of SasG using simulations. Simulations of (A) G52 and (B) E–G52 by coarse-grained native-centric model simulations at 320 K. A, Upper and B, Upper show the rmsd as a function of simulation time for a typical refolding event. (A) For G52, rmsd values were calculated for all atoms (black), the C-terminal β-sheet/loop region (cyan), and the N-terminal β-sheet/loop region (red). (B) For E–G52, rmsd values were calculated for all atoms (black), the C-terminal β-sheet/loop region of G52 (cyan), the N-terminal β-sheet/loop region of G52 together with the C-terminal β-sheet/loop region of E (red), and the N-terminal β-sheet/loop region of E (orange). A, Lower and B, Lower illustrate corresponding sequential snapshots from the refolding trajectory and the related schematic topology representation. The G52 domain is shown in red, except for the C-terminal β-sheet/loop region (cyan) and its central C-terminal docking strand (green). The E domain is shown in blue. Additional details from the same trajectory are illustrated in SI Appendix, Fig. S3.

