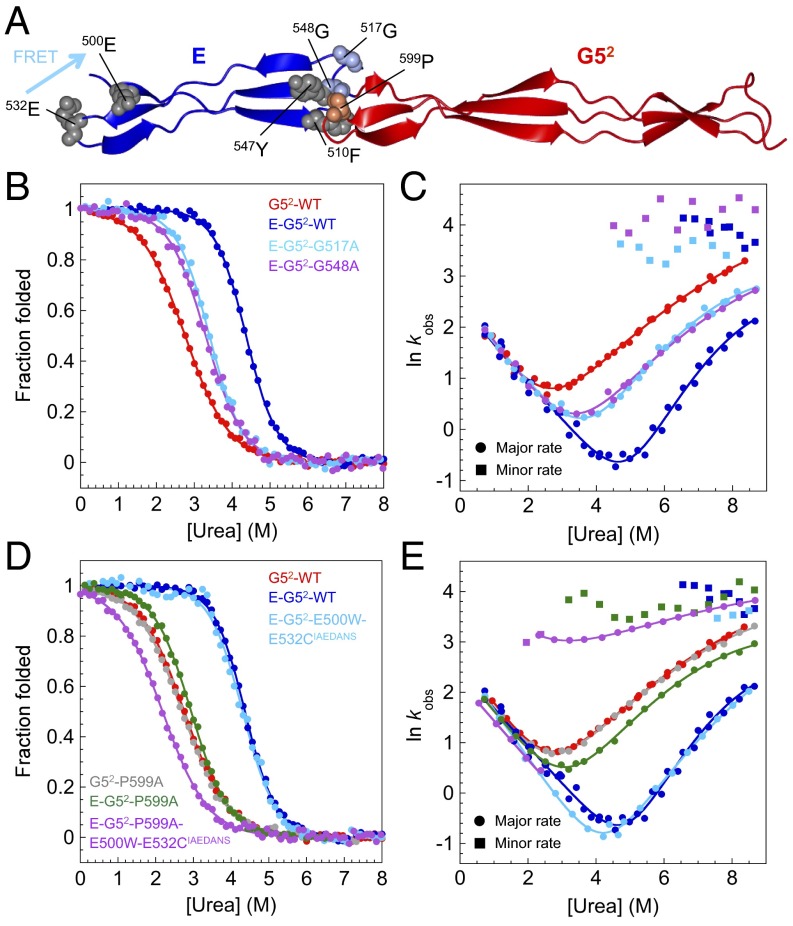
Fig. 4.
Mutations at the interface break the cooperative unfolding of E–G52. (A) Structure of E–G52 showing the location of mutated residues within the E domain (Gly517, Gly548; light blue) and G52 domain (Pro599; orange). Phe510 and Tyr547 (gray) contact Pro599. (B and C) Mutations in the E domain: (B) Equilibrium denaturation curves and (C) urea dependence of the natural logarithm of the observed rate constants for WTs and mutants. (D and E) Mutations in the G52 domain: (D) equilibrium denaturation curves and (E) urea dependence of the natural logarithm of the observed rate constants for WTs and mutants. Circles and squares in C and E represent major and minor rate constants, respectively. Mutations at the interface result in the breakdown of the cooperative unfolding of the E and G52 domains manifested in the presence of a second unfolding rate constant at all denaturant concentrations and a decrease in the dependence of lnku on [urea].

