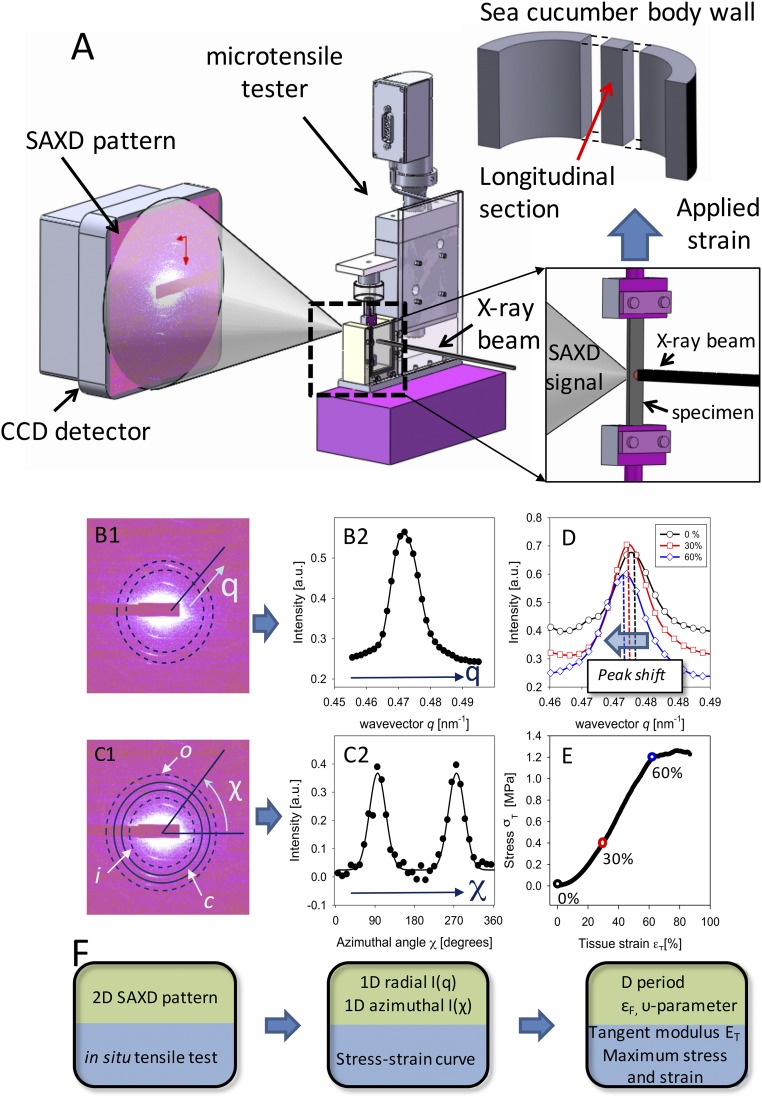
Fig. 2.
In situ nanomechanics with synchrotron SAXD. (A) Experimental configuration: Tensile tester (Center) with MCT specimen mounted along the X-ray beam path in transmission geometry with CCD detector (Left). (A, Right, Inset) Magnified view of sample in chamber and incident X-ray beam (right) with SAXD scattering shown on left. The tensile strain is applied along the vertical direction. (A, Upper Right) Schematic of body wall of sea cucumber shown in Fig. 1, with tensile test specimen sectioned with long axis parallel to the long axis of the animal. (B) Data reduction pipeline: (B, 1) A 2D SAXD pattern from collagen fibrils in sea cucumber dermis MCT with predominant fibril orientation vertical. Radial (q) direction is indicated. Dotted lines denote the ring over which the azimuthal averaging of intensity is carried out. (B, 2) The azimuthally averaged radial intensity profile I(q) for the pattern in B, 1. (C, 1) The same 2D SAXD pattern as in B, 1, with the inner, outer, and central rings (i, o, and c, respectively) shown schematically, over which radial averaging of intensity is carried out. Azimuthal (χ) direction is indicated. (C, 2) The radially averaged intensity profile I(χ). In B, 2 and C, 2 both experimental data (solid circles) and fits to model functions (solid lines) are shown. (D) Radial intensity profile I(q) for three levels of applied tissue strain εT = 0% (circles), 30% (squares), and 60% (diamonds), showing the shift of peak position to lower wavevector with increasing strain. (E) Tissue stress–tissue strain plot for sea cucumber dermis in tension, with circles (black, 0%; red, 30%; blue, 60%) indicating the points from which the I(q) plots in D are shown. (F) Flowchart corresponding to the data reduction steps in B, 1–C, 2, with parameters obtained at each step indicated.

