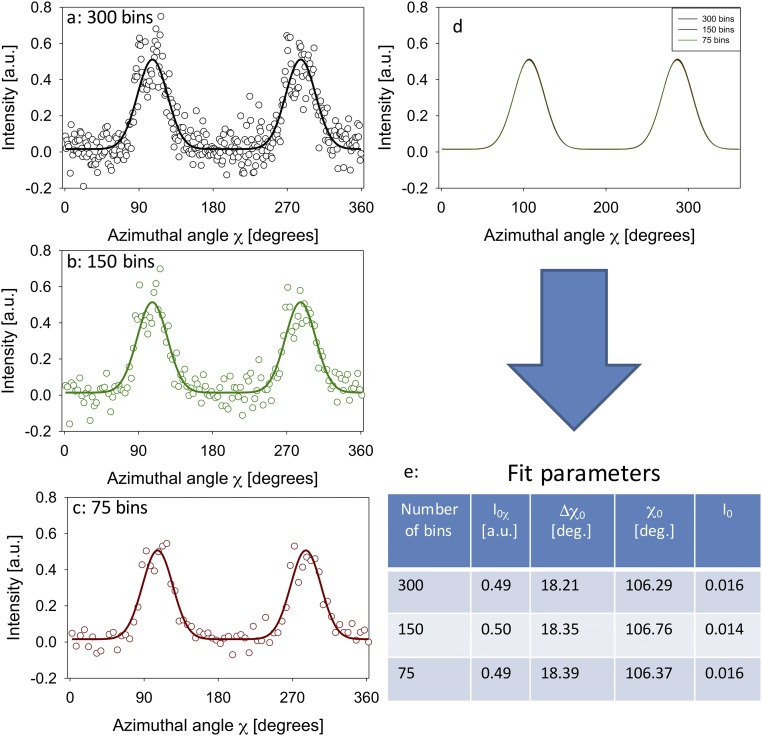
Fig. S2.
(A–C) Plots of azimuthal intensity profiles I(χ) for a single SAXD pattern with three different numbers of azimuthal bins, along with the fits to the model function of two Gaussians with a constant. (D) Superimposition of the fit functions for A–C, showing that the functions are close to identical. (E) Likewise, the fit parameters for the model function are shown in Table S1 to be very similar.

