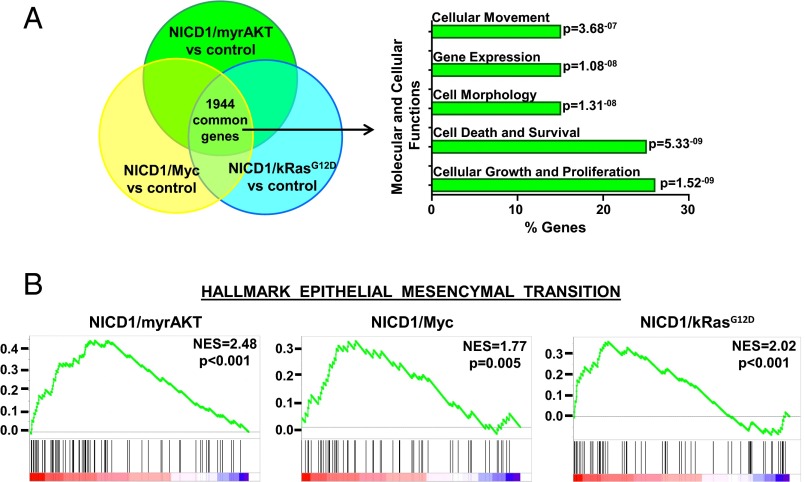
Fig. 4.
Expression profiling of NICD1-driven tumors reveals the EMT signature. (A) Venn diagram of genes differentially expressed in NICD1/kRasG12D, NICD1/myrAKT, and NICD1/Myc versus normal mouse prostate. A total of 1,944 common differentially expressed genes were analyzed for molecular and cellular functions using Ingenuity engine software. The top statistically significant molecular and cellular functions are presented with the corresponding P values. (B) The plots show the GSEA of genes differentially expressed in NICD1/myrAKT, NICD1/Myc, or NICD1/kRasG12D versus normal mouse prostate. NES, normalized enrichment score.

