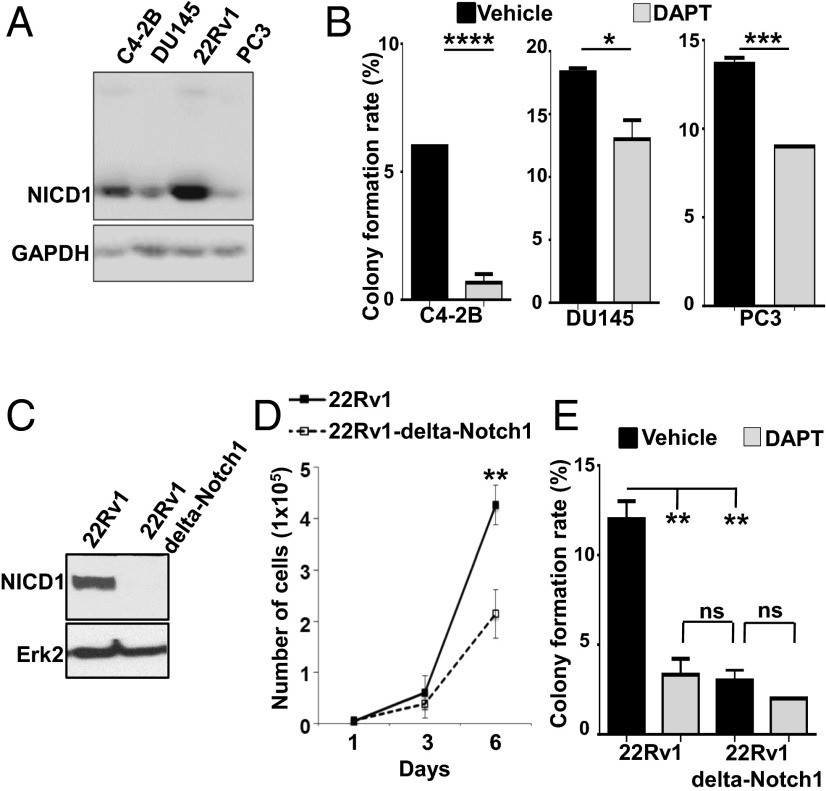
Fig. 7.
Notch1 down-regulation and γ-secretase inhibition delay prostate cancer cell growth. (A) C4-2B, DU145, 22Rv1, and PC3 cells were lysed and subjected to Western blot analysis with antibodies against NICD1 and GAPDH. (B) C4-2B, DU145, and PC3 cells were subjected to a colony-formation assay. Plated cells were treated with DMSO (vehicle) or 25 μM GSI-IX (DAPT) every 48 h for 9 d. The mean colony-formation rate is plotted. Statistical analysis was performed by Student t test. ****P < 0.0001; *** P < 0.005; *P < 0.05; ns, nonsignificant. One of the two independent experiments is shown. (C) 22Rv1 and 22Rv1 ΔNotch1 cells were lysed and subjected to Western blot analysis with antibodies against NICD1 and Erk-2. (D) 22Rv1 or 22Rv1Δ Notch1 cells (1 × 10⁴) were plated. Cell number was counted 1, 3, and 6 d after plating. Student t test was used for statistical analysis. **P < 0.01. (E) 22Rv1 and 22Rv1 ΔNotch1 cells were subjected a colony-formation assay. Cells were treated with DMSO (vehicle) or 25 μM GSI-IX (DAPT) every 48 h for 9 d. The mean colony-formation rate is shown. Student t test was used for statistical analysis. **P < 0.01; ns, nonsignificant.

