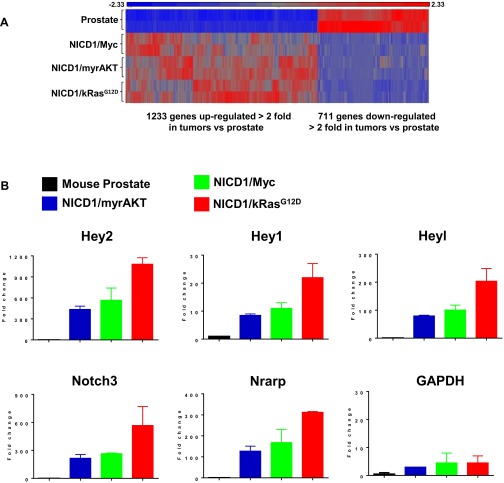
Fig. S6.
Tumors driven by NICD1 in combination with pathways altered in prostate cancer express high levels of Notch1 target genes. (A) Heat map of common genes differentially expressed in NICD1/Myc, NICD1/myrAKT, and NICD1/kRasG12D tissue versus normal mouse prostate. Red represents genes overexpressed, and blue represents genes down-regulated across all NICD1/Myc, NICD1/myrAKT, and NICD1/kRasG12D tissues versus normal mouse prostate. (B) The fold change in reads per kilobase per million mapped reads (RPKM) of transcript of Notch1 target genes (Hey2, Hey1, Heyl, Notch3, and Nrarp) and GAPDH from our RNA-sequencing analysis is shown. The average of RPKM of each gene in the mouse prostate is considered as 1.

