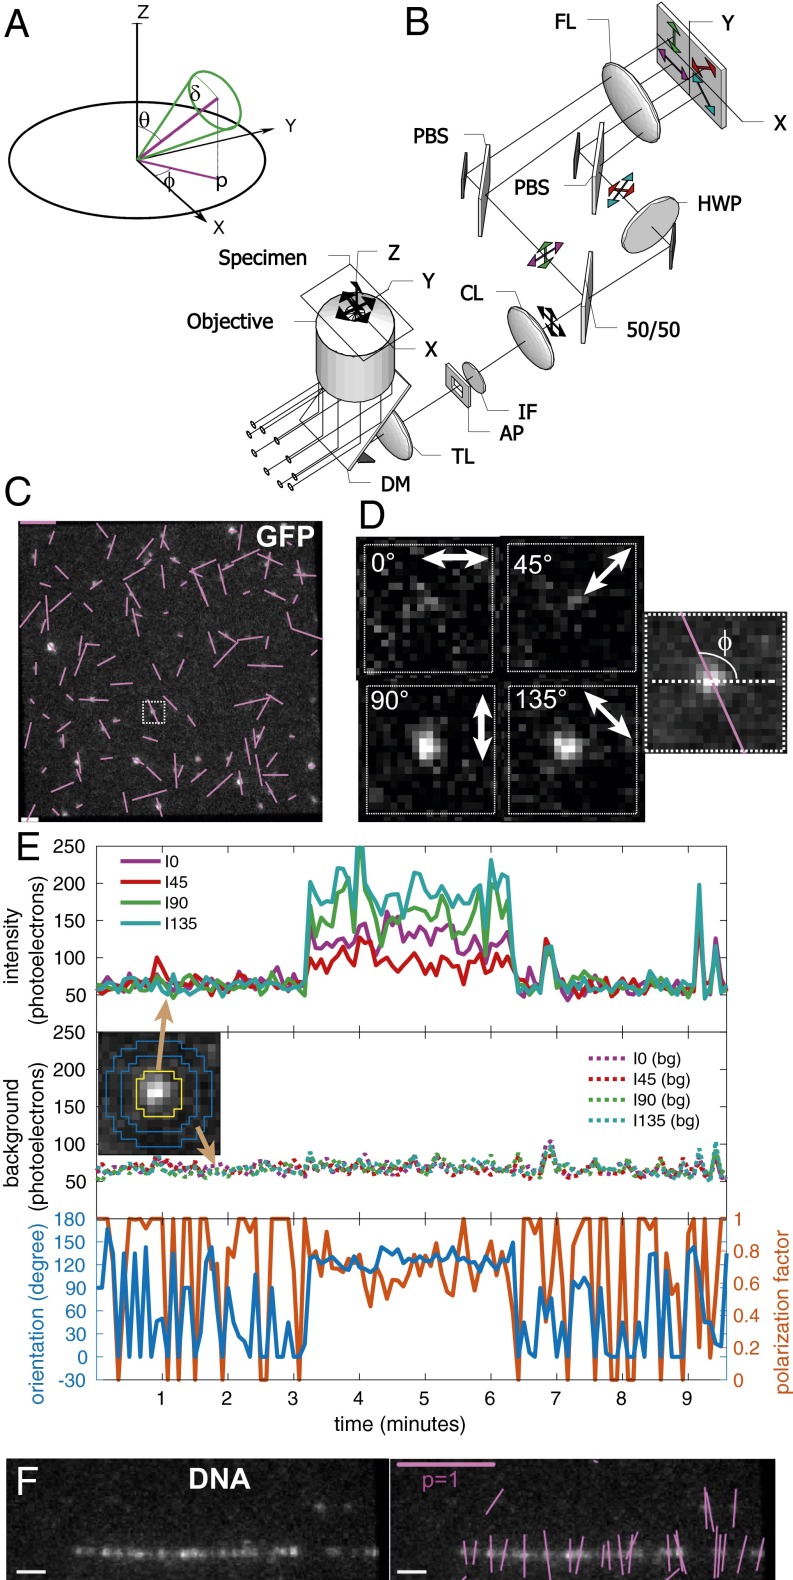
Fig. 1.
Imaging orientation of fluorescent single molecules with instantaneous FluoPolScope. (A) Coordinate system used to parameterize single dipoles and their ensembles (thick green line through origin) by their net orientation in the focal plane (XY), net tilt relative to the optical axis of the microscope (Z), and wobble during the exposure. (B) Schematic of the microscope. AP, aperture; CL, collimating lens; DM, dichroic mirror; IF, interference filter; PBS, polarization beam splitter; TL, tube lens. (C) Polarization resolved fluorescence images of GFP molecules attached to coverslip. (D) Enlarged images of single GFP molecule identified by the outlined square in C. Right shows the computed dipole orientation as a magenta line overlaid on the sum of all polarization-resolved images. (E) Particle intensities (Top), background intensities (Middle), and orientation and polarization factor (Bottom) of the single GFP molecule shown in D that was recorded for more than 3 min. Inset in Middle identifies the pixels used to estimate particle intensities (area enclosed by the yellow line) and background intensity (circular area between two blue lines) in each quadrant. (F) Fluorescence images of λ phage DNA stained with 50 nM TOTO-1 (Left) and the image with orientations of polarized fluorescence of detected particles shown by magenta lines (Right). (Scale bars: magenta in C and F, polarization factor = 1; white in C and F, 1 μm.)

