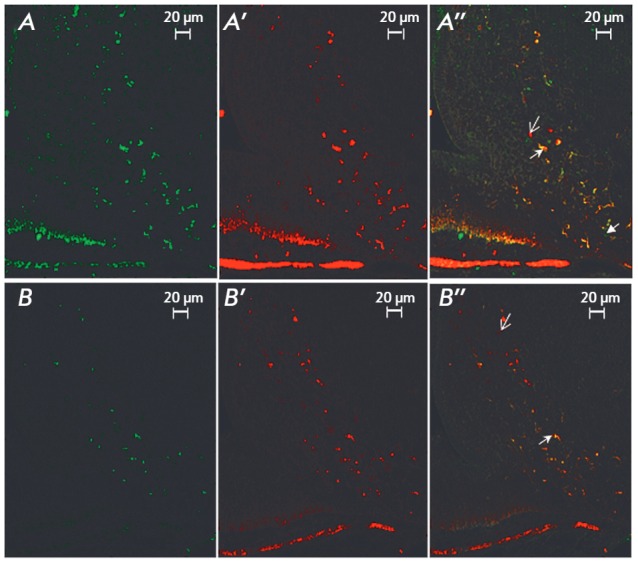
Fig. 5.

Fluorescence microscopy. Images of tyrosine hydroxylase positive (A, B), aromatic amino acids decarboxylase positive (A’, B’), and tyrosine hydroxylase and aromatic amino acids decarboxylase positive (A’’, B’’) neurons in the arcuate nucleus in the control (A, A’, A’’) and after stereotactic injection of 6-OHDA (B, B’, B’’). Arrows indicate neurons of different phenotypes
