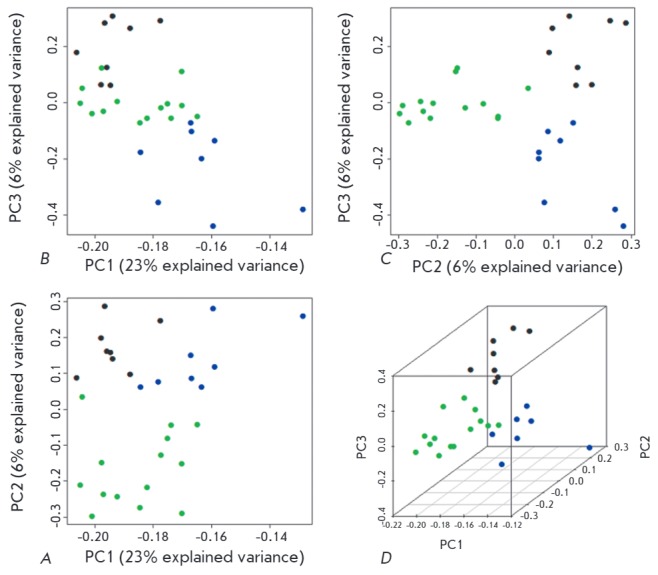
Fig. 2.

2D (A–C) and 3D (D) samples clustering based on a principal component analysis (PCA) of differentially methylated sites (DMSs). The green dots indicate RRMS samples; blue dots PPMS samples; and black dots, healthy controls. The axes: the principal components PC1, PC2, and PC3; the proportion of explained variance of the data is indicated in brackets for each principal component.
