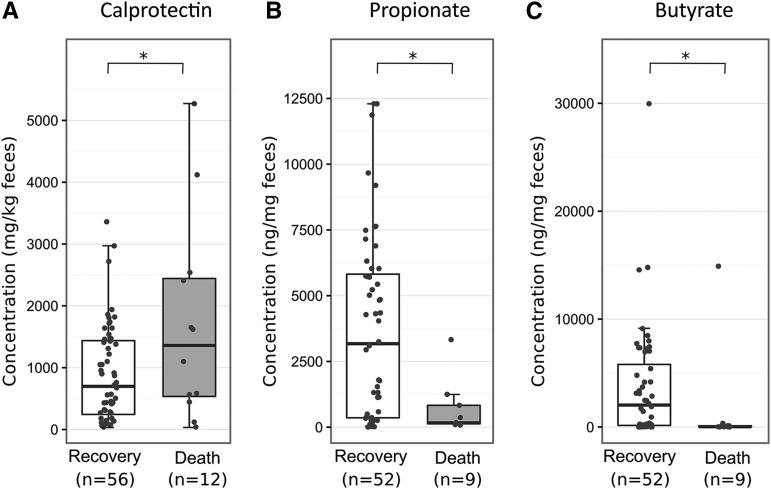
FIGURE 1.
Concentrations of calprotectin (n = 68; A), propionate (n = 61; B), and butyrate (n = 61; C) in fecal samples from children with severe acute malnutrition who recovered or died. Boxplots summarize the median (midline) and IQRs (upper and lower boxes); overlaid dots indicate all individual data points. Medians (IQRs) for groups that recovered or died were as follows: for calprotectin, 697.5 mg/kg feces (1437.5–243.8 mg/kg feces) compared with 1360 mg/kg feces (2442.5–535 mg/kg feces, P = 0.03); for propionate, 3173.8 ng/mL (5819.2–357.2 ng/mL) compared with 167.2 ng/mL (831.4–130.9 ng/mL, P = 0.04); and for butyrate, 2035.7 ng/mL (5799.6–149.1 ng/mL) compared with 31.3 ng/mL (112.3–21.6 ng/mL), P = 0.02). Group differences were tested by logistic regression. *P < 0.05.

