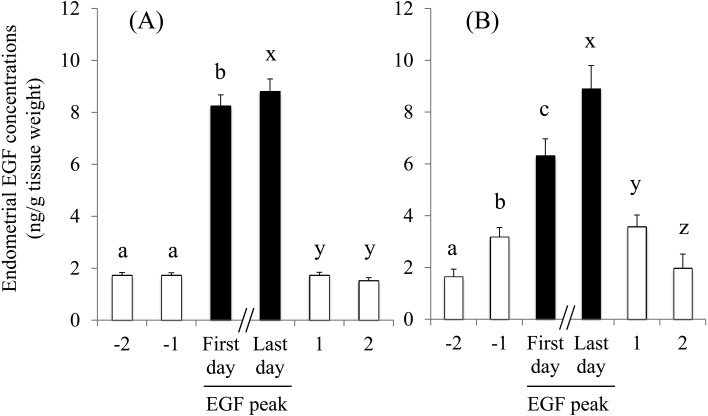
Fig. 3.
Changes in endometrial epidermal growth factor (EGF) concentrations prior to and after the peaks between Days 1 and 6 (A) and Days 11 and 16 (B). Data from 13 and 6 cows in which the increased EGF concentrations were first detected on Days 3 (A) and 13 (B), respectively, were used to compare EGF concentrations 1 and 2 days prior to and on the first day of the EGF peaks. Data from 13 and 4 cows in which EGF concentrations started to decrease prior to or on Days 5 (A) and 15 (B), respectively, were used to compare EGF concentrations on the last day of the peak and the following 2 days. The EGF concentrations with different letters differed significantly (a, b, c, and x, y, z, P < 0.01).

