Fig. 2.
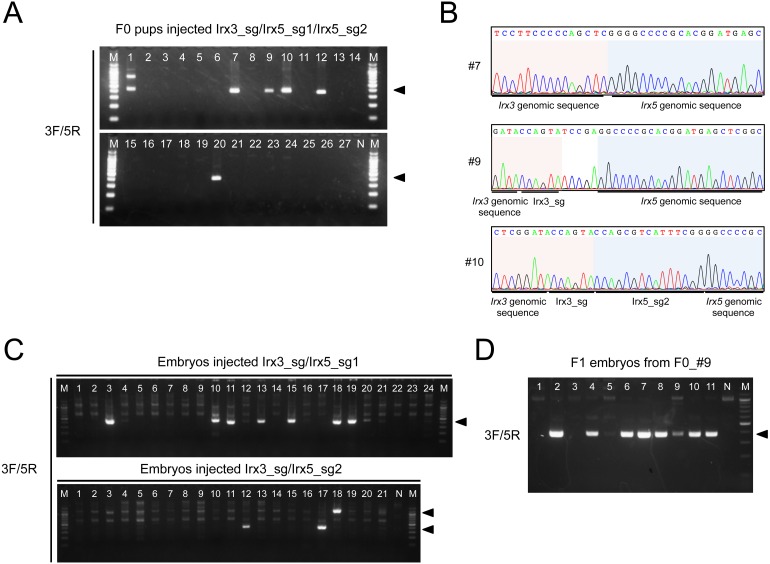
Detection of 0.5 Mb deletion in mutant mice. (A) Detection of the 0.5 Mb deletion in the genome of pups injected with Irx3_sg/Ix5_sg1/Irx5_sg2 with Cas9. Agarose gel electrophoresis image of PCR products amplified using 3F and 5R. Arrowheads indicate the position at which bands containing the amplified fragments appear. (B) Representative electropherograms of PCR fragment sequences. The genomic sequences of Irx3 and Irx5 are shaded in red and blue backgrounds, respectively. (C) Detection of the 0.5 Mb deletion in the genome of mouse embryos injected with Cas9 and Irx3_sg/Irx5_sg1 or Irx3_sg/Irx5_sg2, respectively. Agarose gel electrophoresis image of PCR products amplified using 3F and 5R. (D) Detection of the 0.5 Mb deletion in the F1 embryos obtained from mouse F0_#9. Arrowheads indicate the position at which bands containing the amplified fragments. N, no template control; M, 100 bp DNA ladder marker.

