Fig. 1.

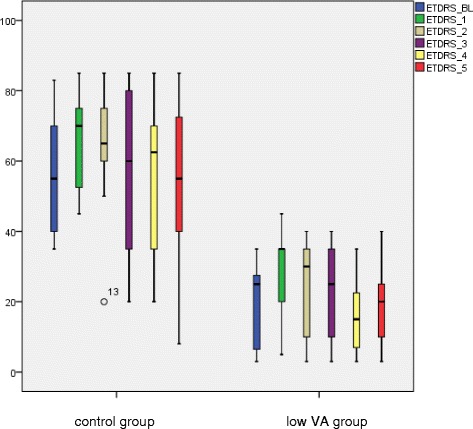
Visual acuity course of the low visual acuity group in comparison to the control group after DEX implantation expressed in ETDRS letters with standard deviation

Visual acuity course of the low visual acuity group in comparison to the control group after DEX implantation expressed in ETDRS letters with standard deviation