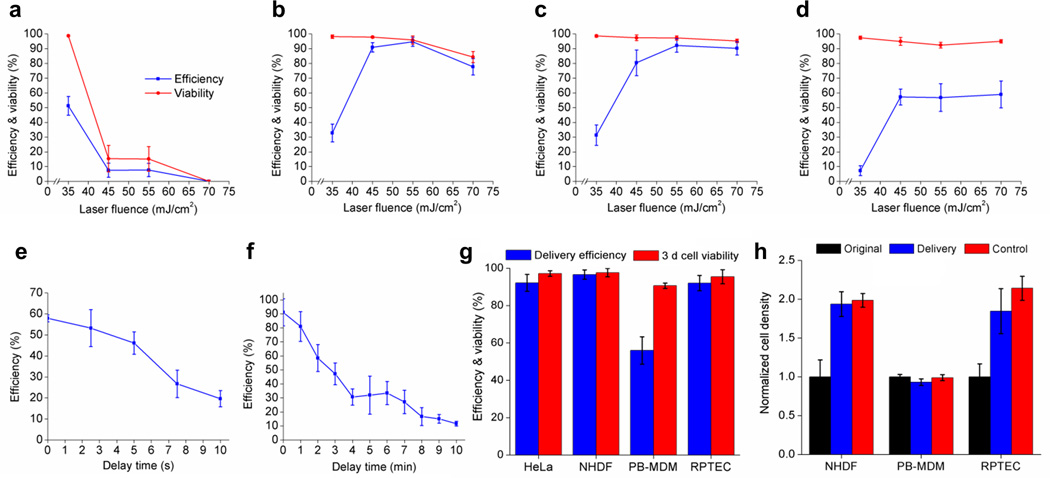
Figure 2. Cell membrane pore opening efficiency, cell viability, and pore resealing time.
(a-d) Plots show laser fluence and hole density are critical in determining optimal delivery conditions. The hole density on the chip varies as follows: (a) 1.15 (b) 0.28 (c) 0.18 or (d) 0.12 holes/10 µm2. Pore opening efficiency is determined by calcein (622 Da) dye uptake for HeLa cells. Error bars, s.d. (n = 2,031; 1,483; 1,601; 1,975 for a; b; c; d) (cell density: 1,138 cells/mm2). (e,f) Characterization of the transient window for large cargo and small molecule delivery. (e) Live bacteria, F. novicida, were delivered into HeLa cells at different delay time between laser pulsing and fluid pumping. Error bars, s.d. (n = 1,926; 2,062; 2,335; 2,406; 2,106 for 0; 2.5; 5; 7.5; 10 s). (f) Calcein was delivered at different time delays. The cell membrane pores remain permeable for longer than 10 min for small molecule delivery. Error bars, s.d. (n = 5,891 for all tests). (g) FITC-dextran (40 kDa) delivery efficiency and 3 d cell viability for different kinds of primary mammalian cells. Error bars, s.d. (n = 2,030; 1,512; 1,464; 532 for HeLa; NHDFs; PB-MDMs; RPTECs). (h) FITC-dextran (40 kDa) delivered primary cells were cultured on chips for 3 d and compared with their original cell densities. Control cells were seeded on chips at the same time without laser pulsing and fluid pumping. Error bars, s.d. (n = 3,062; 3,017; 1,149 for NHDFs; PB-MDMs; RPTECs) (initial cell densities: 265; 534; 98 cells/mm2 for NHDFs; PB-MDMs; RPTECs).

