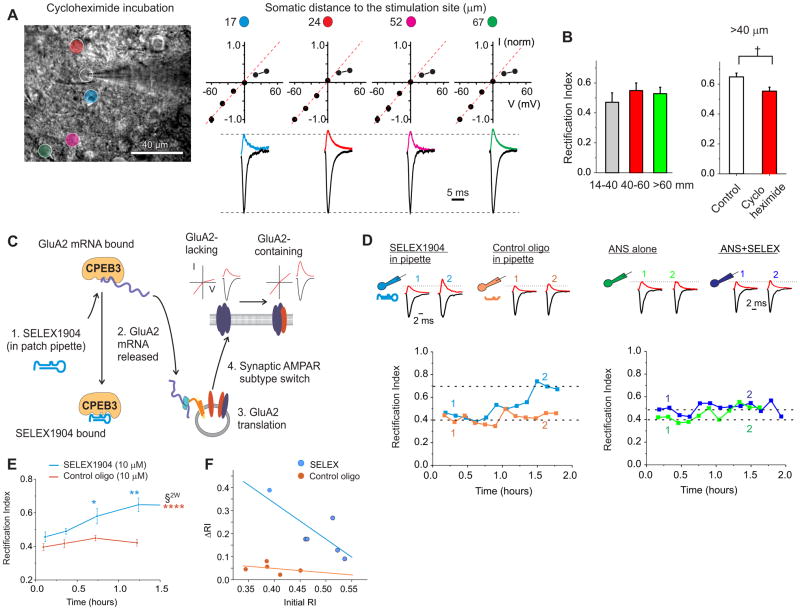
Figure 4. Disruption of the CPEB3-GluA2 mRNA interaction enhances synaptic GluA2 expression at the proximal dendrites in a protein synthesis-dependent manner.
A. Cerebellar slices were incubated with 100 μM cycloheximide (CHX) for 3 hrs and then synaptic currents were recorded and evoked at the stimulation sites labeled in the left panel. Spermine (100 μM) was included in the pipette solution to block synaptic GluA2-lacking receptors at positive potentials. Right: Average EPSC traces recorded at +40 and −60mV and corresponding I-V relationship. B. The increase in the RI of EPSCs at the distal synapses was abolished following CHX treatment (7 sites for proximal; 6 for intermediate; 4 sites for distal from 6 cells; 6 mice) and EPSC RI at > 40 μm was reduced compared to control (P < 0.05). C. SELEX1904 is an RNA oligomer that competes with GluA2 mRNA for binding to CPEB3 (Huang et al., 2006). If CPEB3 binding with GluA2 mRNA prevents GluA2 protein synthesis at proximal synapses, SELEX1904 should increase synaptic GluA2 expression in stellate cells. D. Left: Example of evoked EPSCs at a proximal synapse. Including SELEX1904 (10 μM) in the pipette solution increased EPSC amplitude at +40 mV and the I-V relationship of EPSCs became more linear with time, indicating an increase in synaptic GluA2 receptors. Control oligo sequence was identical to SELEX1904, but was missing several terminal nucleotides needed to stabilize the hairpin 3D conformation that disrupts CPEB3/GluA2 mRNA interaction, see Methods. Right: Anisomycin (ANS), when added to ACSF prior to and during recording, prevented the SELEX-induced increase in EPSC RI. E. RI of EPSCs remained unaltered during the first 30 minutes and then gradually increased at proximal dendrites (< 40 μm, n = 6). A control oligomer (10 μM) did not alter the amplitude (B) and RI of EPSCs (n = 5). (Two-way ANOVA, P < 0.0005 for treatment groups and for time bins; Tukey means comparison vs either control, *, P < 0.01; **: P < 0.005; or vs time bin 1, ***: P < 0.0005). F. The initial RIs are those recorded within 15 min (4 cells) and between 15–30 min (2 cells in which we were unable to find the inputs within 15 min) after obtaining the whole cell configuration. Change in RI (Δ RI) was calculated as a difference between the average RI after it reached a plateau and the initial RI (linear regression for SELEX, R2 = 0.62 and for CTL oligo, R2 = 0.11). See also Figure S4.

