
Fig. 3.
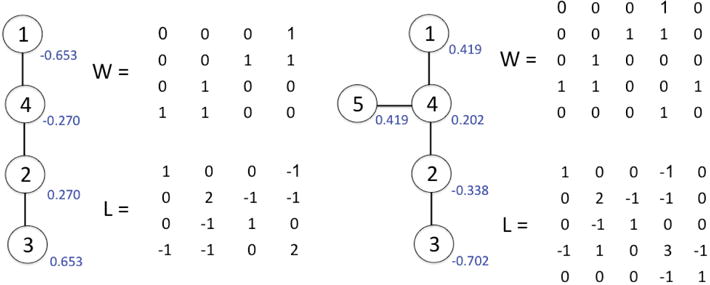
A graph, the weights W and the graph Laplacian L. The weights are simply the adjacency matrix. The second eigenfunction ψ1 value is displayed in blue. (a) This example is given in [7]. The maximum geodesic distance is obtained between the nodes 1 and 3, which are also hot and cold spots. (b) In this example, there are two hot spots 1 and 5 which correspond to two maximal geodesic paths 1-4-2-3 and 5-4-2-3.