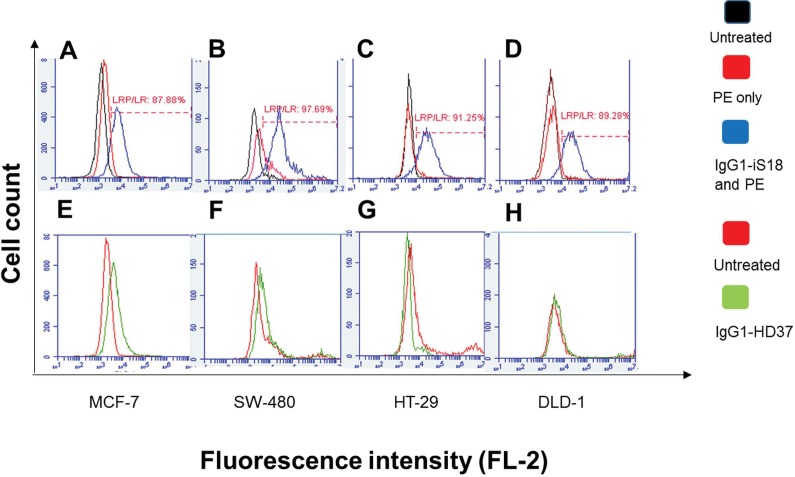
Figure 2.
Detection of 37 kDa/67 kDa LRP/LR levels on the surfaces of tumorigenic cell lines. Cells were treated with IgG1-iS18 and IgG1-HD37 (control antibody). (A and E) represent MCF-7, (B and F) represent SW-480, (C and G) represent HT-29, and (D and H) represent DLD-1. In graphs (A, B, C and D) the black peak represents untreated cells, the red peak indicates cells labeled with goat antihuman phycoerythrin–coupled secondary antibody only and the blue peak represents cells labeled with anti-LRP–specific antibody IgG1-iS18 together with secondary antibody, both at a concentration of 30 μg/mL. In graphs (E, F, G and H) the red peak indicates untreated control to show no nonspecific binding from the secondary antibody; the green peak represents control antibody IgG1-HD37 together with the secondary antibody. These data represent experiments performed in triplicate using different cell cultures, with 20,000 cells counted per sample.

