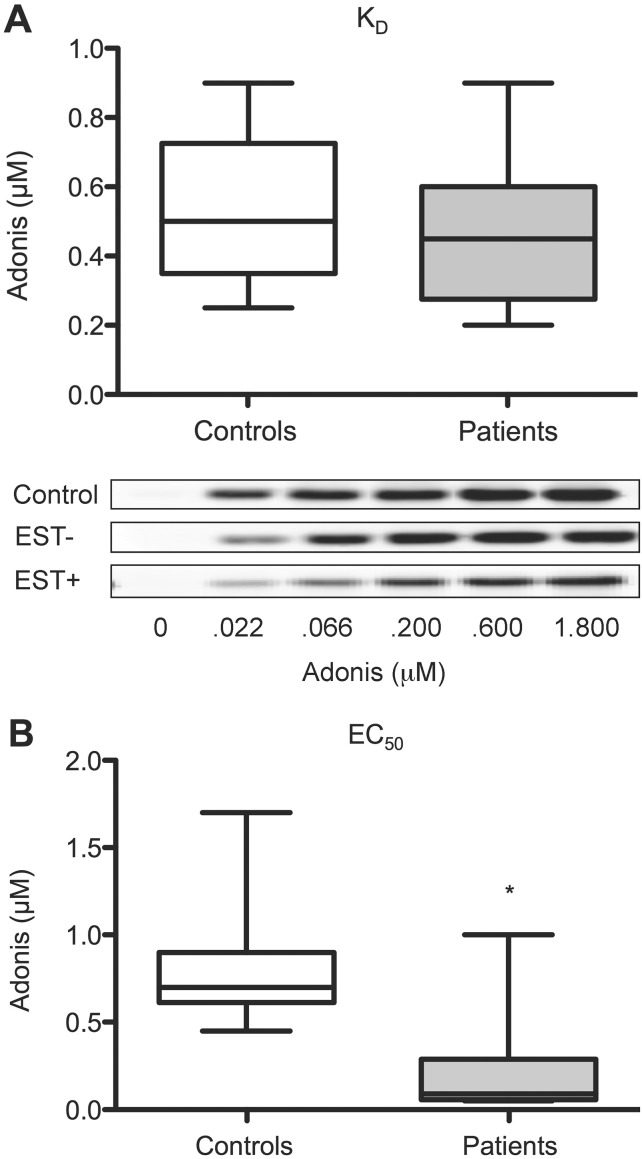
Figure 2.
Adenosine A2A receptor characterization. (A) KD and EC50 were interpolated from dose-response curves obtained using increasing concentrations of Adonis, an anti-A2AR monoclonal antibody with agonist properties (see methods). Comparison of KD values (controls versus patients: P = 0.3; Western blot analysis of the light chain [25 kDa] of Adonis in a representative sample of each group of interest are shown in the insert). (B) Comparison of EC50 values (*: P < 0.01).

