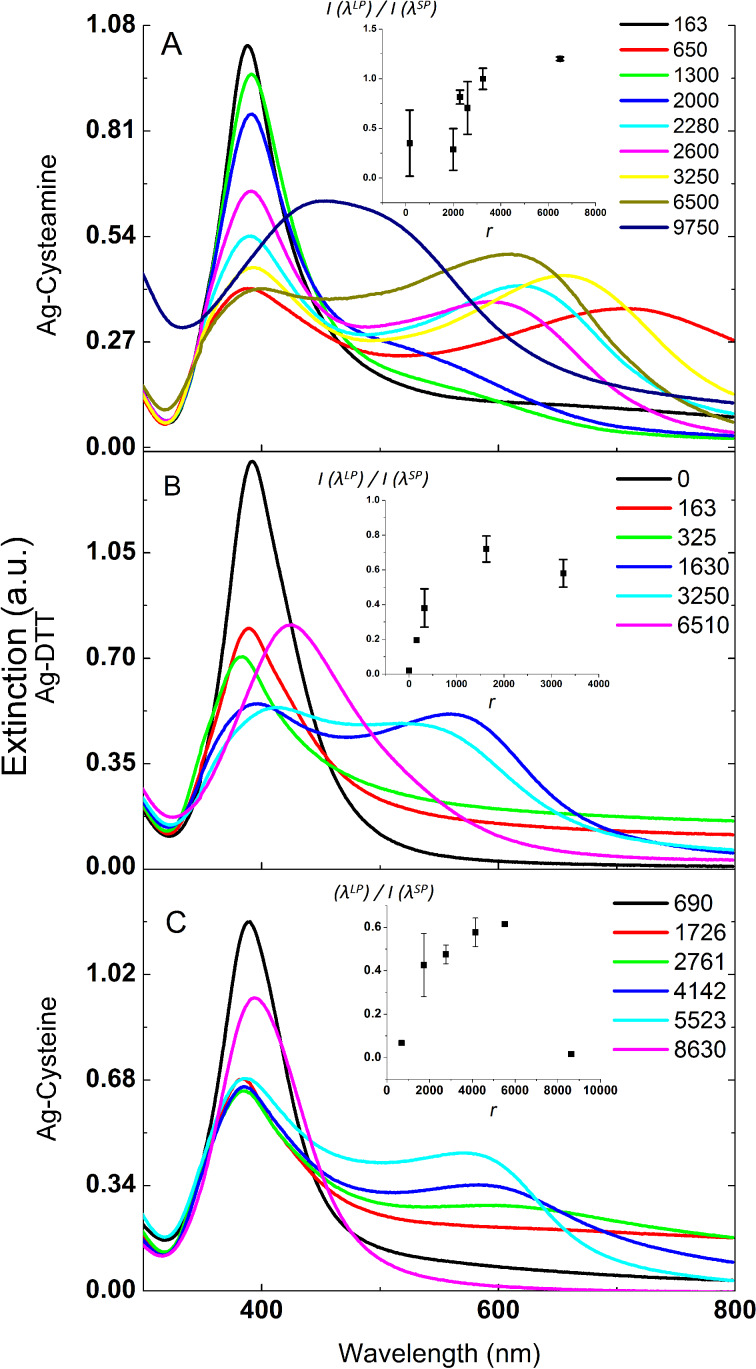
Figure 1.
Extinction spectra of AgNPs modified by varying ratios of ligands: A) cysteamine, B) DTT and C) cysteine. Legend: r = number of ligand molecules/AgNP. Insets show the growth of the longitudinal plasmon band (LP) relative to the transverse band (SP) as a function of r. Error bars represent the standard deviations of independent spectral measurements from the average value for every ligand ratio. The most intense anisotropy is noticed in the case of cysteamine-modified AgNPs with a ratio exceeding unity at 5000 < r < 9000.

