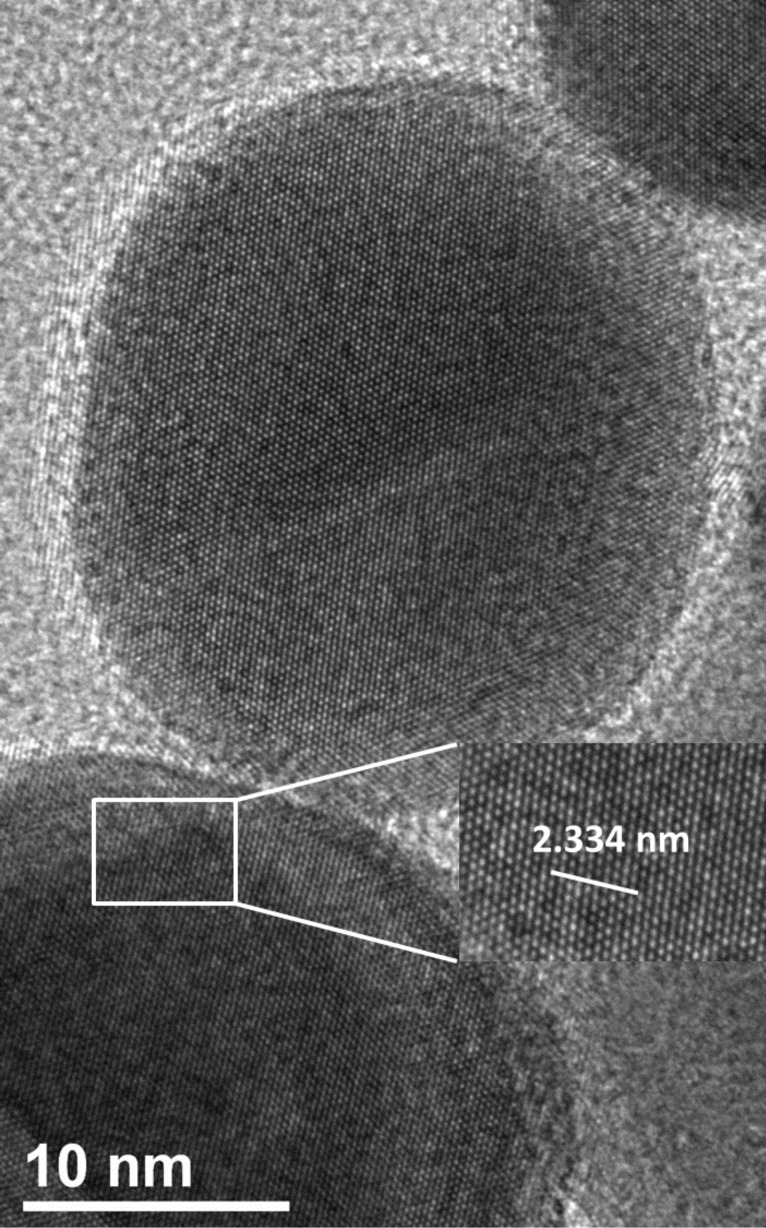
Figure 4.
HRTEM image of AgNPs ensembles. The distance shown in the image corresponds to 10 × d. Here, d is the inter-planar distance, which was determined using the relation  , where a is the lattice constant (4.08 Å for silver). It shows that the interacting facets are the [111] crystal facets, so the zone axis is 011.

