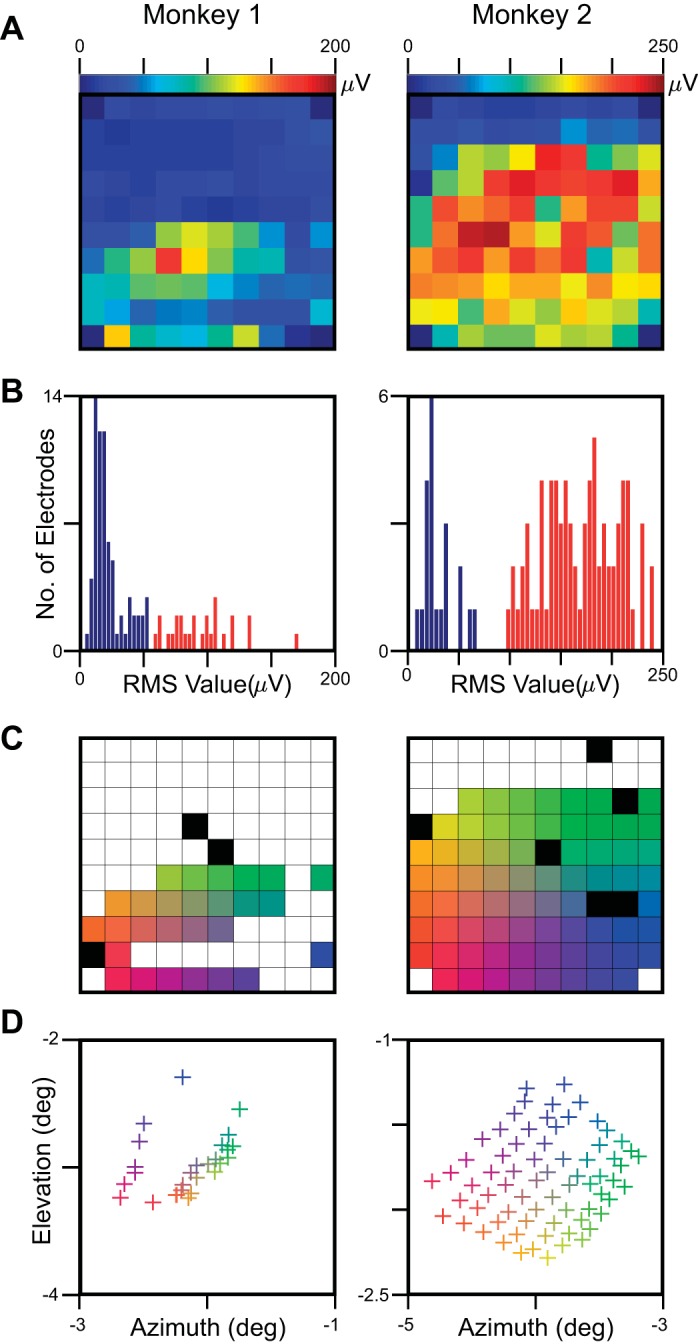
Fig. 1.

Electrode-selection criteria for LFP. The difference in root mean square (RMS) value between stimulus (40–100 ms) and baseline (−100 to −40 ms) epoch was computed for each of the 9 × 9 or 11 × 11 stimulus positions, and the maximum value across all of these positions was computed. A: heat map of the maximum RMS values averaged across all recording sessions for the 96 active microelectrodes in a 10 × 10 microarray grid. B: the histogram of the maximum RMS values. The electrodes with maximum RMS value above a particular cutoff (shown in red) were used for further analysis. C: selected electrodes, color coded based on their position on the microarray grid. Red/yellow, left edge of the grid and most medial (almost parallel to the midline); yellow/green, top edge, most anterior. The electrodes shown in black had high impedance (>2,500 kΩ) and were excluded. D: receptive field (RF) centers of the selected (27 for Monkey 1 and 71 for Monkey 2) electrodes. As expected from the anatomy of V1, the movement in the lateral direction (red to blue or yellow to green) made the RFs more foveal. Similarly, the movement in the anterior direction (red to yellow or blue to green) decreases the elevation.
