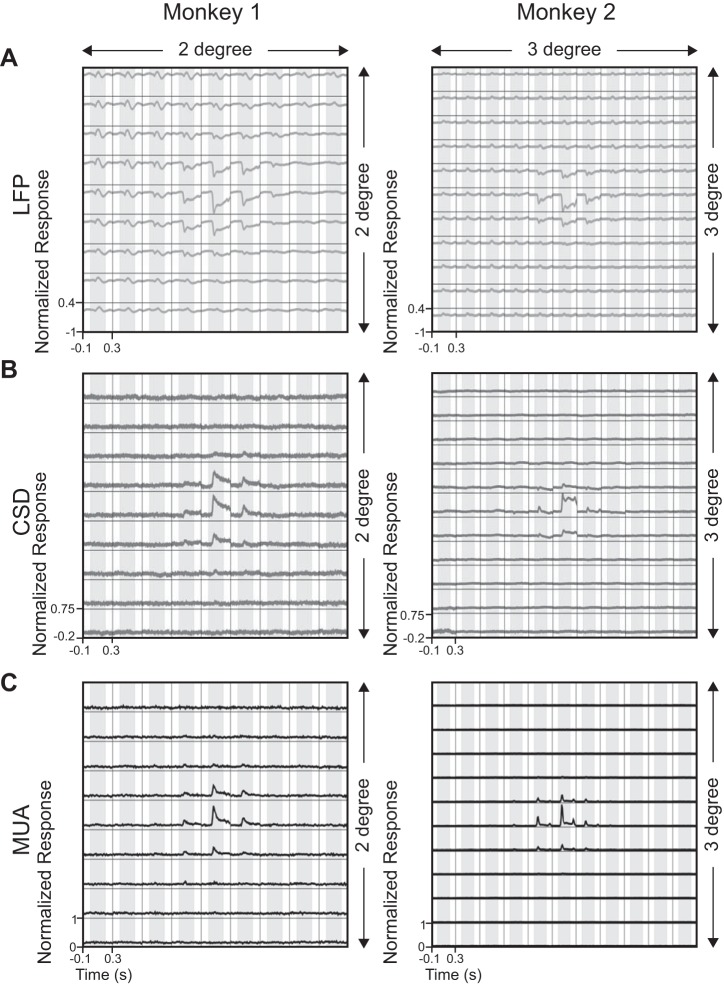
Fig. 3.
Population responses of LFP, CSD, and MUA for both of the monkeys. A: evoked LFP responses averaged over 27 (Monkey 1) and 71 (Monkey 2) electrodes after first normalizing, shifting, and averaging the traces, such that for each electrode, the maximum response occurred near the center (see text for details). B: mean CSD responses across 16 (Monkey 1) and 39 (Monkey 2) electrodes. C: mean MUA responses across 18 (Monkey 1) and 67 (Monkey 2) electrodes. CSD and MUA traces for individual electrodes were shifted by the same amount as for the LFP traces.

