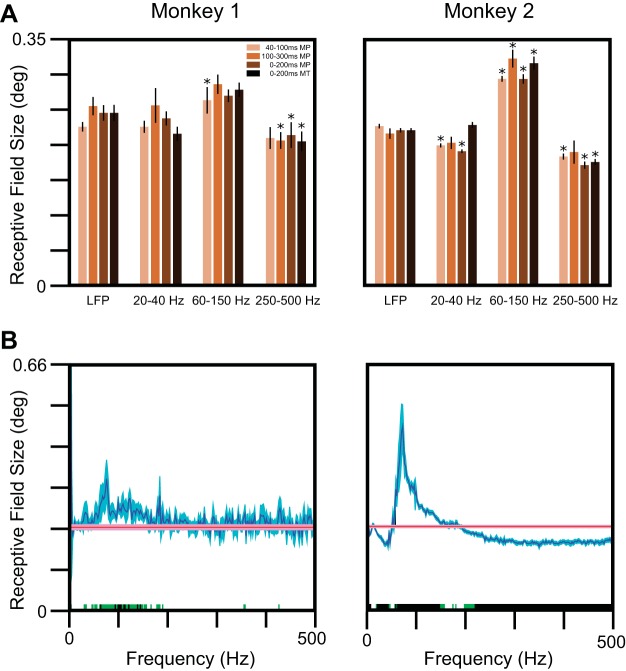
Fig. 6.
RF sizes in the spectral domain. A: median RF sizes across electrodes estimated using the LFP RMS values and using the total energy in 3 frequency bands (ranges indicated at the bottom), when the analysis interval was between 40 and 100, 100 and 300, and 0 and 200 ms after stimulus onset using matching pursuit (MP) and 0 and 200 ms using the multitaper (MT) method, as shown in the legend. The error bars indicate SE, obtained using bootstrapping. Frequency bands for which the RFs are significantly different from the LFP RF size are shown with asterisks (*P < 0.05, with Bonferroni correction for both multiple frequency ranges and time periods, Kruskal-Wallis test). B: median LFP spread across electrodes as a function of frequency (blue traces). For comparison, the RF size for the LFP is also shown (red traces). The SE, obtained using bootstrapping, is shown in lighter shades. Frequencies at which the medians are significantly different are shown in green (P < 0.05, without Bonferroni correction, Kruskal-Wallis test) or black (P < 0.05, with Bonferroni correction, Kruskal-Wallis test).

