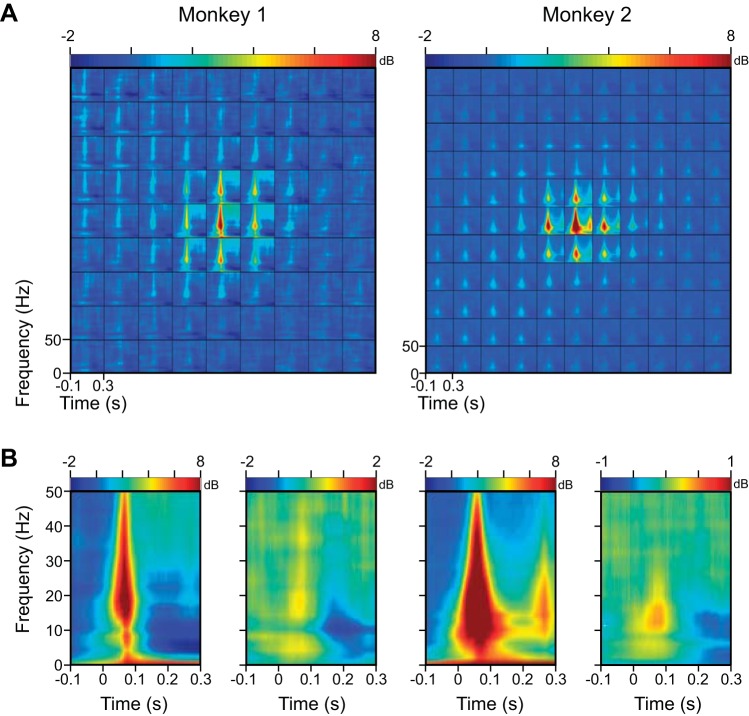
Fig. 8.
Time-frequency energy difference plots showing the change in energy (in decibels) from baseline (−100 to 0 ms; change computed separately at each frequency). A: same as Fig. 5A, but data are shown only up to 50 Hz to highlight the low-frequency components, as we observed a decrease in alpha band power (dark blue band). B: time-frequency energy difference plot at the central position (left) and the average across 4 extreme corner positions (right). Even when stimulus was far away from the RF center, there was a small onset transient and alpha suppression. Note the change in scale for the plot on the right.

