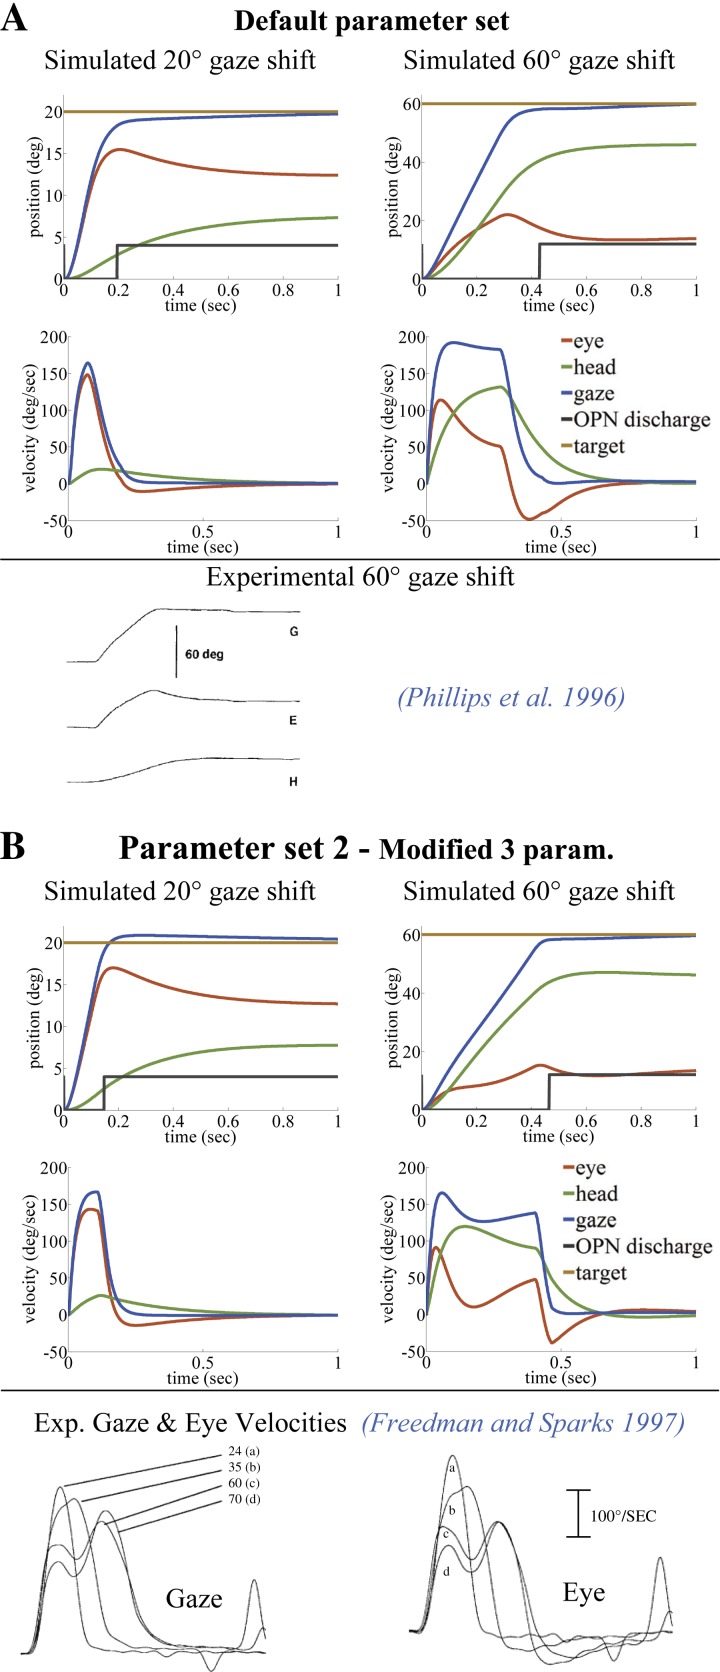
Fig. 4.
Comparison of typical gaze trajectories in primate, simulated with single-peak (A) or double-peak (B) eye/gaze velocities (left, 20°; right, 60°). Only 3 of the 13 default parameters in A are modified in B for the double-peak effect (see Table 2). As reported, double peaks appear only for larger gaze shifts. The black switch line in position traces shows the OPN pause period, which can end before or after the peak eye deviation. Simulations in A and B replicate reported observations by Phillips et al. (1996) and Freedman and Sparks (1997), respectively.

