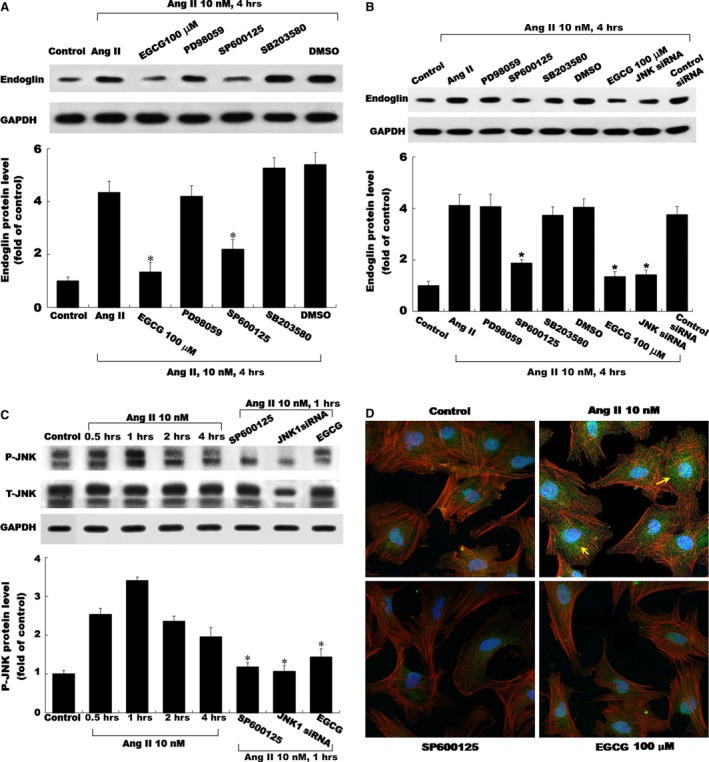
Figure 3.

Molecular signalling regulation of Ang II‐induced endoglin in CFs. Representative Western blots for the endoglin protein levels in CFs subjected to Ang II induction for 4 hrs or control cells without Ang II induction in both the absence and presence of inhibitors, EGCG and siRNA. EGCG (100 nM) and inhibitor SP600125 revealed inhibitory effects on the endoglin expression in a concentration‐dependent manner (A, B and C). (D) Endoglin of serum‐starved CFs was stained with tetramethylrhodamine isothiocyanate–phalloidin (green dot) and observed through inverse fluorescence microscopy. Representative imaging showing endoglin protein levels (green dot) were apparently decreased and changed with either JNK inhibitor (SP600125) or EGCG (100 nM) treatment compared with the Ang II‐stimulated plate. Original magnification, ×200. The values from stimulated CFs have been normalized to those in the control group. *P < 0.05 versus control (the repeated number was 3 per group). CFs, cardiac fibroblasts; EGCG, epigallocatechin‐3‐O‐gallate.
