
Figure 2.
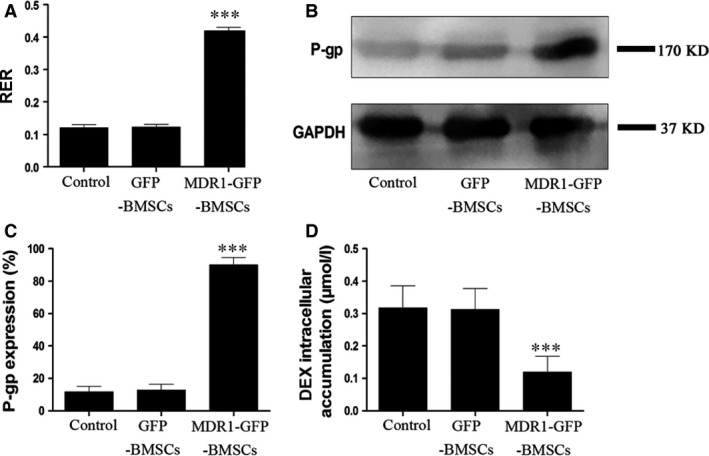
P‐gp activity and expression in control BMSCs, GFP‐BMSCs and MDR1‐GFP‐BMSCs. (A) RER. (B) Representative images of Western blots for P‐gp and GAPDH expression. (C) Quantitative results for relative P‐gp expression. (D) Intracellular DEX accumulation. Data are expressed as mean ± S.D. ***P < 0.01 relative to control BMSCs and GFP‐BMSCs.