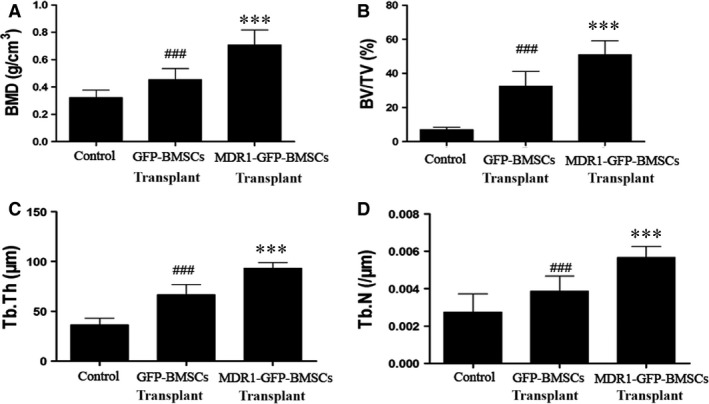
Figure 5.

Determination of bone histomorphometric parameters in femoral head. (A) BMD, (B) BV/TV, (C) Tb.Th and (D) Tb.N. Data are expressed as mean ± S.D. ***P < 0.01 relative to control group and GFP‐BMSC transplant group. ### P < 0.01 relative to control group.
