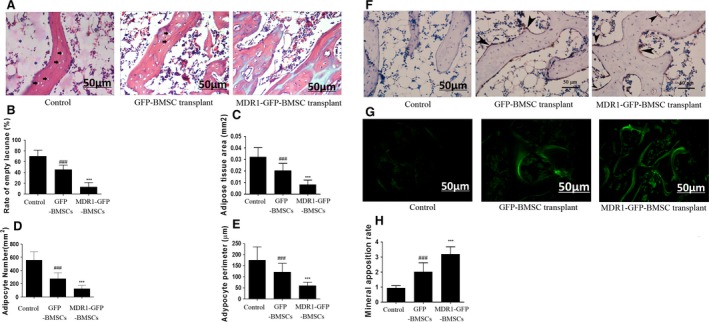
Figure 6.

Analyses of adipogenesis and osteogenesis in the femoral head. (A) Haematoxylin–eosin staining for observation of empty lacunae (black arrow), thickness and density of trabeculae, bone marrow cell necrosis (*), and numbers and sizes of adipocytes in the femoral head of rats that received saline (control treatment), GFP‐BMSCs or MDR1‐GFP‐BMSCs. (B) Rate of empty lacunae. (C) Adipose tissue area. (D) Adipocyte number. (E) Adipocyte perimeter. (F) Immunohistochemical staining for GFP in sections of the femoral head. Positive staining mainly occurred in cells (black arrowhead) attached to the surface of the trabeculae and shaped like osteoblasts after transplantation of GFP‐BMSCs or MDR1‐GFP‐BMSCs. (G) Tetracycline fluorescence indicating new bone formation. (H) MAR. In all panels, data are expressed as mean ± S.D. ***P < 0.01 relative to control group and GFP‐BMSC transplant group. ### P < 0.01 relative to control group.
